We’re entering the era of AI agents. These systems do not just retrieve isolated facts or generate brief summaries. They synthesize multiple sources of complex information to answer challenging, multi-dimensional questions. At Samaya, our AI agents routinely face such demanding queries from financial analysts. For example:
“Summarize NVIDIA’s latest earnings call, compare key financial metrics against previous forecasts, and provide a detailed SWOT analysis based on the company’s strategic outlook.”
These questions require long detailed answers, spanning multiple paragraphs or even pages. Providing a good answer requires coordination across several specialized components. Evaluating the quality of these complex outputs is challenging because traditional component-level metrics miss crucial interactions between components.
In this blog post, we introduce Criteria-Eval, our internal evaluation framework specifically designed to measure the end-to-end quality of complex, long-form answers. Instead of relying on reference answers or generic rubrics, Criteria-Eval uses objective, yes-or-no checklists written by domain experts to assess factual accuracy, completeness, formatting, and more.
This approach makes evaluation precise, flexible, and, most importantly, directly aligns with how expert users judge quality.
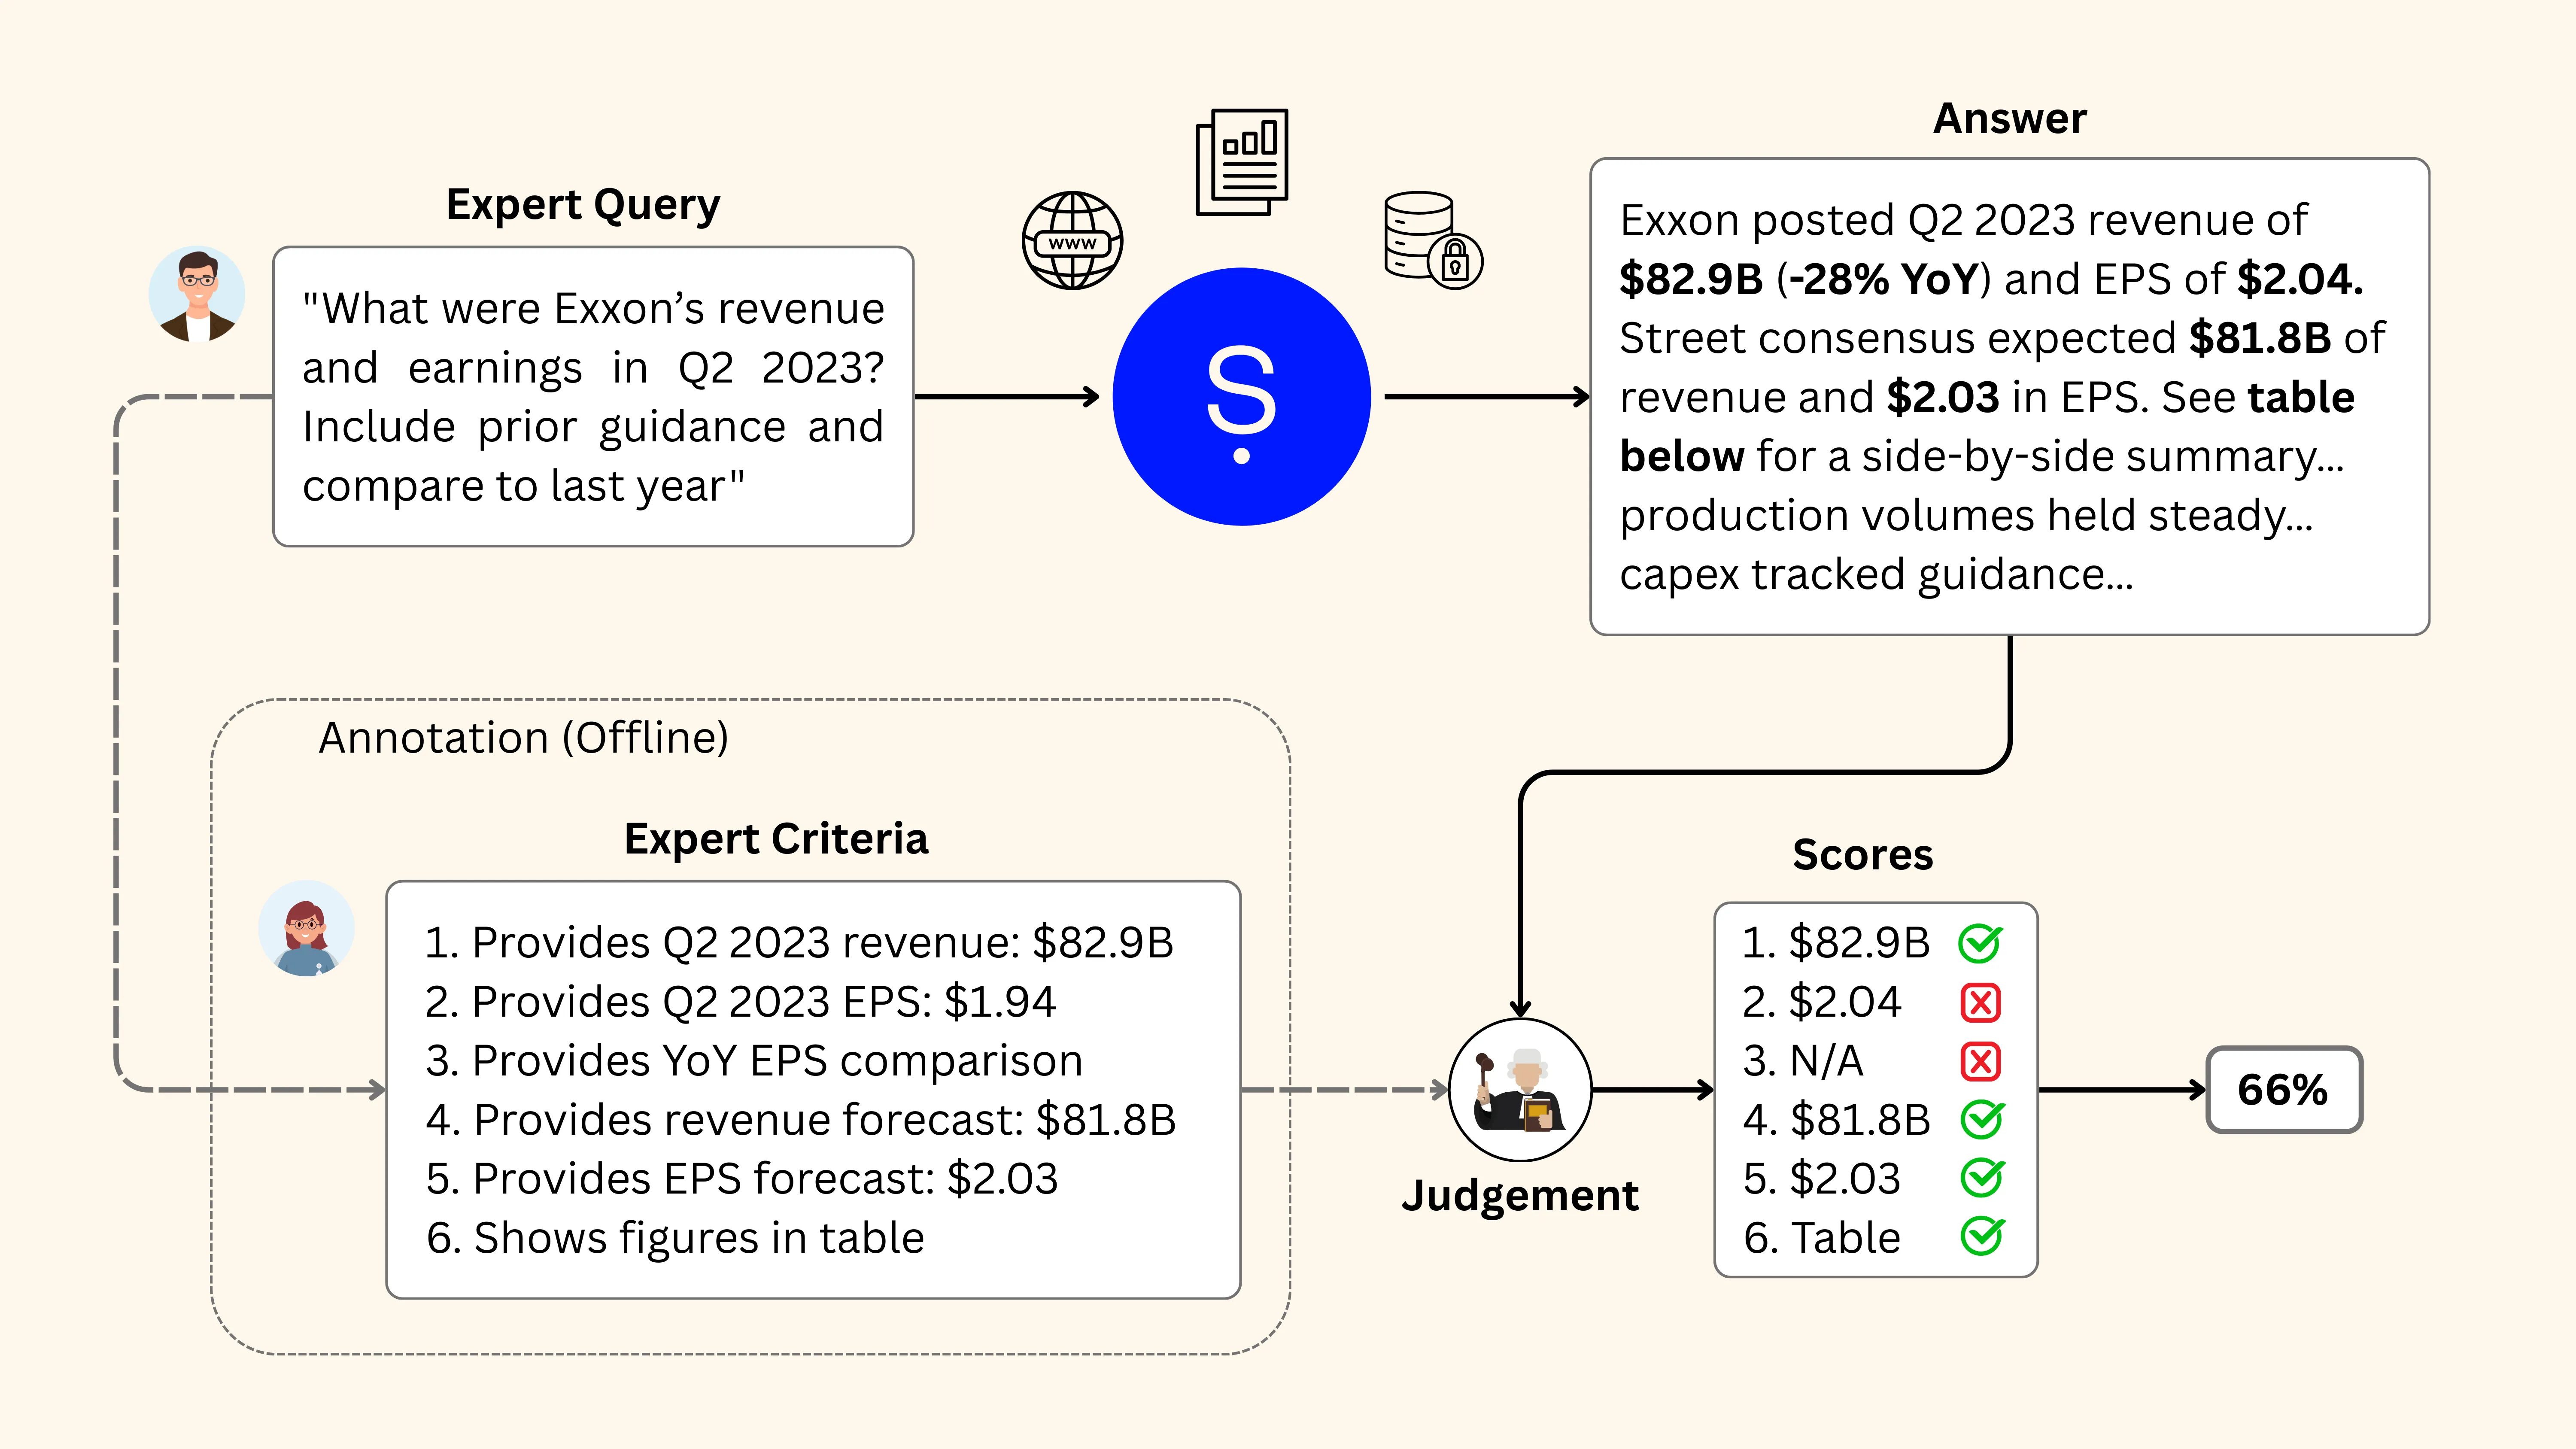
Figure 1: Domain experts first research authoritative sources to answer a complex, multi-part financial query. They then produce a binary checklist of factual and formatting criteria that any correct answer must meet. The system’s response is evaluated against this checklist using an LLM-as-a-Judge setup, with each criterion scored independently. The final score reflects the proportion of checklist items satisfied, capturing the end-to-end quality of the answer.
When building complex systems, component-level evaluation is a natural starting point. We began there, measuring our retrievers, entity disambiguators, query orchestrators, etc., with targeted metrics. While useful individually, these metrics fail to account for critical interactions and error propagation between components.
What we ultimately care about is end-to-end performance:
Did the user receive the accurate, complete, and actionable answer they needed?
Component-level metrics simply can’t capture this.
Early on, we heavily relied on side-by-side product testing sessions and user feedback to judge quality end-to-end. It was manual, slow, and reactive. Crucially, it made catching regressions and making confident deployment decisions incredibly difficult. This was a gap we needed to fill.
Criteria-Eval addresses these shortcomings by shifting the evaluation mindset from reference generation to criteria specification:
We use domain experts (financial professionals) to define the criteria that a good answer should meet rather than asking them to write reference answers.
This checklist-based approach (Ribeiro et al. 2020) enables us to explicitly evaluate both retrieval quality and generation accuracy simultaneously.
Each criterion is a simple, clear assertion that must explicitly appear in the final answer (e.g., “Apple’s fiscal 2023 revenue was $383.3 billion”). This approach has several advantages:
We started collecting data for Criteria-Eval approximately a year ago, and we’ve continuously expanded our dataset since then. As of now, the dataset includes:
This dataset represents a substantial investment of expertise and time, with our financial domain experts dedicating more than 8000 hours to meticulous annotation work.
Annotators adopt the role of a financial research analyst asked to answer a query. Their deliverable is an exhaustive bullet-point checklist with the facts, analyses, and formatting cues a perfect two-page report would need.
The process is governed by comprehensive internal guidelines.2 The workflow looks like this:
We have collected a wide range of questions financial analysts actually ask. The table below shows the most common types of questions.
Table 1: Taxonomy of the most common types of questions in our dataset, along with a typical example and what the checklist will demand.
Once the checklist is written, Criteria-Eval uses LLM-based judges to evaluate system responses. Each answer is scored against its checklist, one criterion at a time.
For every criterion, the LLM judge reads the system’s output and returns a binary judgment:
Pass: if the answer fully satisfies the criterion.Fail: if the fact, analysis, or instruction is missing, incorrect, ambiguous, or incomplete.The final score is simply the percentage of criteria met.
Criteria-Eval assigns high scores if and only if the system both retrieves and faithfully presents all these critical facts. Missing criteria immediately indicate specific retrieval or generation gaps.
Criteria-Eval includes many open-ended and researchy questions such as:
While each query typically contains a set of core criteria that are critical (but easier) to address, there is also a deliberate, extensive tail of supplementary criteria. This is by design: by asking annotators to provide exhaustive and detailed criteria we are preventing Criteria-Eval from saturation.
We measured the overlap between the sets of criteria generated by different annotators for the same questions, and we found that on average the overlap is roughly 29%. This reflects the fact that there are multiple valid answers to the same question and provides a benchmark for our systems to reach human level performance on this ambiguous task.5
In a landscape where benchmarks are quickly saturated, Criteria-Eval remains demanding and provides meaningful signal for improvement.
Below are four representative examples of how Criteria-Eval is applied to real-world financial questions. Each example illustrates a specific type of analyst query, along with the corresponding expert-generated checklist criteria used to assess answer quality. Select the tabs to explore each query type in detail.
To understand how answer quality scales with increasing question complexity, we compared two distinct retrieval strategies using Criteria-Eval. Both systems use the same LLM to synthesize final answers, but differ in how they retrieve supporting evidence.
We grouped queries by the number of criteria per query, serves as a proxy for question complexity. Complexity varied from simpler queries (~5 criteria) to highly intricate queries (~35+ criteria).
More criteria generally signal a more demanding, multi-faceted question

Figure 2: Criteria-Eval accuracy across queries grouped by number of checklist criteria. While both systems perform similarly on simple queries (5–10 criteria), the RAG baseline degrades sharply as complexity grows. Samaya maintains stable performance across all difficulty levels. The dashed line at represents the average criteria overlap between human annotators on the same query, providing a useful human reference point.
To help contextualize these results, the dashed line marks the average overlap between the set of criteria generated by different annotators for the same query. This provides a useful human reference point for interpreting system performance (see the Built to Resist Saturation section for more details). The results are shown in Figure 2, and we observe the following:
These results clearly demonstrate the benefits of a specialized multi-component retrieval and orchestration pipeline, especially as query complexity increases and conventional RAG approaches fall short. Criteria-Eval inherently reveals these differences by naturally encoding query complexity through its criteria-driven scoring.
Current generative evaluation paradigms primarily rely on LLM-as-a-Judge (Zheng et al., 2023), where an auxiliary LLM scores responses against predefined or LLM-generated rubrics (e.g., G-Eval; Liu et al., 2023). While suitable for many general-purpose generation tasks, such as summarization, these rubrics fall short for knowledge-intensive tasks, where quality depends equally on retrieving and faithfully presenting key facts.
Even specialized metrics like FactScore have limitations (Min et al., 2023). FactScore evaluates faithfulness by extracting all claims from a response and verifying them against the retrieved context. While useful for spotting hallucinations, it comes with some limitations:
Criteria-Eval is now a core part of how we build, monitor, and improve our QA systems at Samaya:
At Samaya, rigorous evaluation is not just a technical necessity but a core part of how we build our products. Criteria-Eval in particular has become the cornerstone of our quality assurance strategy, enabling us to consistently meet the high standards of professional analysts. It is an active and evolving dataset, and we continuously enrich it as new user queries emerge, ensuring our systems remain relevant and closely aligned with real-world needs.
As the AI community evolves toward more sophisticated, knowledge-intensive applications, we hope Criteria-Eval serves as a valuable case study for advancing evaluation methodologies.
Ashwin Paranjape, Christos Baziotis, Jack Hessel, and Jack Silva led the design and conceptualization of Criteria-Eval.
Jack Silva led the annotation effort and managed the team of domain experts and wrote the annotation manual.
Mingyi Yang and Christos Baziotis contributed to the engineering and analysis effort.
Special thanks to Yuhao Zhang, Roberto Dessi, Fabio Petroni and Michele Bevilaqua for their valuable discussions and feedback throughout the project.
[1] Because there can be multiple good answers, especially for open-ended finance questions, we collect multiple annotations (criteria lists) per query.
[2] Our internal annotation manual spans over 50 pages and includes examples, decision rubrics, taxonomy definitions, and edge-case resolution protocols. This ensures consistency and domain rigour across annotators.
[3] “Hindsight leakage” refers to the use of information that wasn’t available at the time of the query. In Criteria-Eval, we prevent this by setting a “query date” and ensuring all cited data is publicly available on or before that date.
[4] AI tools, including Samaya, are explicitly banned to ensure that the answers are based solely on the authoritative sources provided. This keeps the evaluation criteria independent and prevents any AI-generated errors from affecting our evaluation framework.
[5] To quantify how much two annotators agree on what constitutes a good answer, we use a cross-evaluation strategy. We start by taking one annotator’s checklist and writing a “perfect” answer that satisfies all their criteria. Then, we evaluate that answer against the checklist written by a second annotator for the same query, exactly as we would evaluate any model-generated response. The proportion of checklist items satisfied in this setup serves as a proxy for the overlap between the two sets of criteria. Averaged across many such annotator pairs, this yields an empirical overlap score of approximately 29%. This number reflects the expected common ground between experts: while many core criteria (e.g., headline figures, key guidance) are shared, there is always an inevitable long tail of more subjective criteria that vary based on an annotator’s judgment. Importantly, if our system exceeds this inter-annotator overlap percentage, it indicates that the system is providing more comprehensive answers that successfully address a broader range of valid criteria than what a typical human expert might include in a single analysis.
Yang Liu, Dan Iter, Yichong Xu, Shuohang Wang, Ruochen Xu, and Chenguang Zhu. (2023). G-Eval: NLG Evaluation using GPT-4 with Better Human Alignment. In Proceedings of the 2023 Conference on Empirical Methods in Natural Language Processing, pages 2511–2522, Singapore.
Sewon Min, Kalpesh Krishna, Xinxi Lyu, Mike Lewis, Wen-tau Yih, Pang Wei Koh, Mohit Iyyer, Luke Zettlemoyer, and Hannaneh Hajishirzi. (2023). FActScore: Fine-grained Atomic Evaluation of Factual Precision in Long Form Text Generation. In Proceedings of the 2023 Conference on Empirical Methods in Natural Language Processing, pages 1165–1183, Singapore.
Marco Tulio Ribeiro, Tongshuang Wu, Carlos Guestrin, and Sameer Singh. (2020). Beyond Accuracy: Behavioral Testing of NLP Models with CheckList. In Proceedings of the 58th Annual Meeting of the Association for Computational Linguistics, pages 747–762, Online.
Lianmin Zheng, Wei-Lin Chiang, Ying Sheng, Siyuan Zhuang, Zhanghao Wu, Yonghao Zhuang, Zi Lin, Zhuohan Li, Dacheng Li, Eric P. Xing, Hao Zhang, Joseph E. Gonzalez, and Ion Stoica. (2023). Judging LLM-as-a-Judge with MT-Bench and Chatbot Arena. In Thirty-seventh Conference on Neural Information Processing Systems Datasets and Benchmarks Track.
Criteria-Eval still relies on the LLM-as-a-Judge approach, as LLMs decides whether each checklist criterion is satisfied by a system’s answer. But before relying on any model, we ran an internal study to evaluate how well different setups align with expert human judgments.
We created a held-out dataset from Criteria-Eval where we sampled system outputs and then manually labeled them against their criteria. This gave us ground-truth judgments which we used to compare different scoring strategies:
Both methods showed ~94% agreement with human judgements, but the multi-LLM setup aligned more reliably with human labels in edge cases.
Experience how Samaya can supercharge financial workflows
Get a DemoWe're backed by Gen AI leaders
The Expert AI Agent Platform Defining
Modern Finance
© 2026 Samaya AI. All Rights Reserved.


"We’ve spoken to ~40 companies offering AI in finance solutions, and done pilots with 10-15. Yours is the only tool that analysts are actively asking for, and saying how useful they find it."
Top 5 Hedge Fund