At Samaya, we want to improve models at predictive tasks, such as forecasting company earnings, through post-training. To do so, we need a capable starting model and enough diverse events whose outcomes it has not already learned.
A model’s reported knowledge cutoff is a natural starting point for selecting these events. Using only earnings announced after that date reduces the risk of prior exposure, but a recent cutoff can leave us with too little data. An older model offers a longer window of events to train on, but may be less capable.
In our earlier earnings prediction evaluation, Claude Fable 5.1 performed poorly when predicting July earnings without access to data, despite a reported June knowledge cutoff. The reported cutoff alone does not tell us which facts a model has retained or can use. We want a more direct measure: one that helps us choose a cutoff for post-training data based on the risk that the model already knows the outcomes.
Asking a model to reproduce an earnings number from memory can miss signs of prior exposure. The correct answer might rise from 1% to 5% probability and still lose to another answer. An exact-answer test would record a failure in both cases. We use open-weight models to inspect the probabilities assigned to the known answer, one token at a time.
We tested four NVIDIA Nemotron models of different sizes. Ultra showed the strongest pattern: on our average-probability measure, correct answers from more than two years before its cutoff received about 75 times as much probability as those from the final 30 days before it. Yet in a separate recall test, Ultra produced the exact answer for just 2 of 272 events, even across five prompts.
How we score memorization
We focus on earnings per share (EPS), the profit attributed to each share. Our earlier analysis covered four financial metrics; in this blog post, we need just one precise number tied to a company, quarter, and announcement date.
We ask each model for historical EPS without supplying the earnings release or tools, then score the known answer one token at a time. In these models, each digit in a number is represented as a token. For example, 0.72 is represented as 0, ., 7, and 2. For a given EPS value, we supply the correct prefix at each step and measure the probability of each token conditioned on the previous ones. This is called teacher forcing; that is, the model does not have to generate the prefix correctly on its own.
P(0.72 | prompt) =
  P(0 | prompt)
  × P(. | prompt, 0)
  × P(7 | prompt, 0.)
  × P(2 | prompt, 0.7)
Multiplying the token probabilities gives the probability of the full answer. We calculate it by adding the log probabilities and exponentiating the sum. The scores come directly from the model; we never ask it to estimate its own confidence.
Exact prompt and scoring settings
All four historical runs use these messages. Fields in braces come from the earnings record; the pretend date is one calendar day after the announcement.
System message
You are answering a closed-book historical earnings recall question. Return the reported EPS figure requested by the question, without changing its accounting basis. Do not forecast, estimate, or use tools. Return only the numeric value, with two digits after the decimal point.User message template
Pretend today is {day_after_event_date}, and you have access to {ticker}'s earnings report from {event_date}. What reported EPS in USD per share was recorded for FY{fiscal_year} Q{fiscal_quarter}?
EPS: $
No report is attached: “pretend” frames a recall question. We apply each model’s native chat template with add_generation_prompt=True and enable_thinking=False. We append the known EPS, formatted to two decimal places and encoded with add_special_tokens=False. We sum only the final N log probabilities, where N is the number of answer tokens.
The strongest signal is in older history
We assembled 3,941 earnings events across 384 stock symbols, from January 2024 through August 2026. We then grouped events by how far they fell before each model’s reported post-training cutoff. To be safe, we exclude the cutoff month itself: for Ultra, April 2026 is before its May cutoff and June is after it. We hold the model fixed throughout; the comparison is between earnings of different ages.
| Model | Total / active parameters | Training cutoff month |
|---|---|---|
| Nano | 30B / 3.5B | November 2025 |
| Super | 120B / 12B | February 2026 |
| Lightning | 30B / 3B | May 2026 |
| Ultra | 550B / 55B | May 2026 |
B means billion parameters. These mixture-of-experts models use only part of their total weights for each token, shown as the active count.
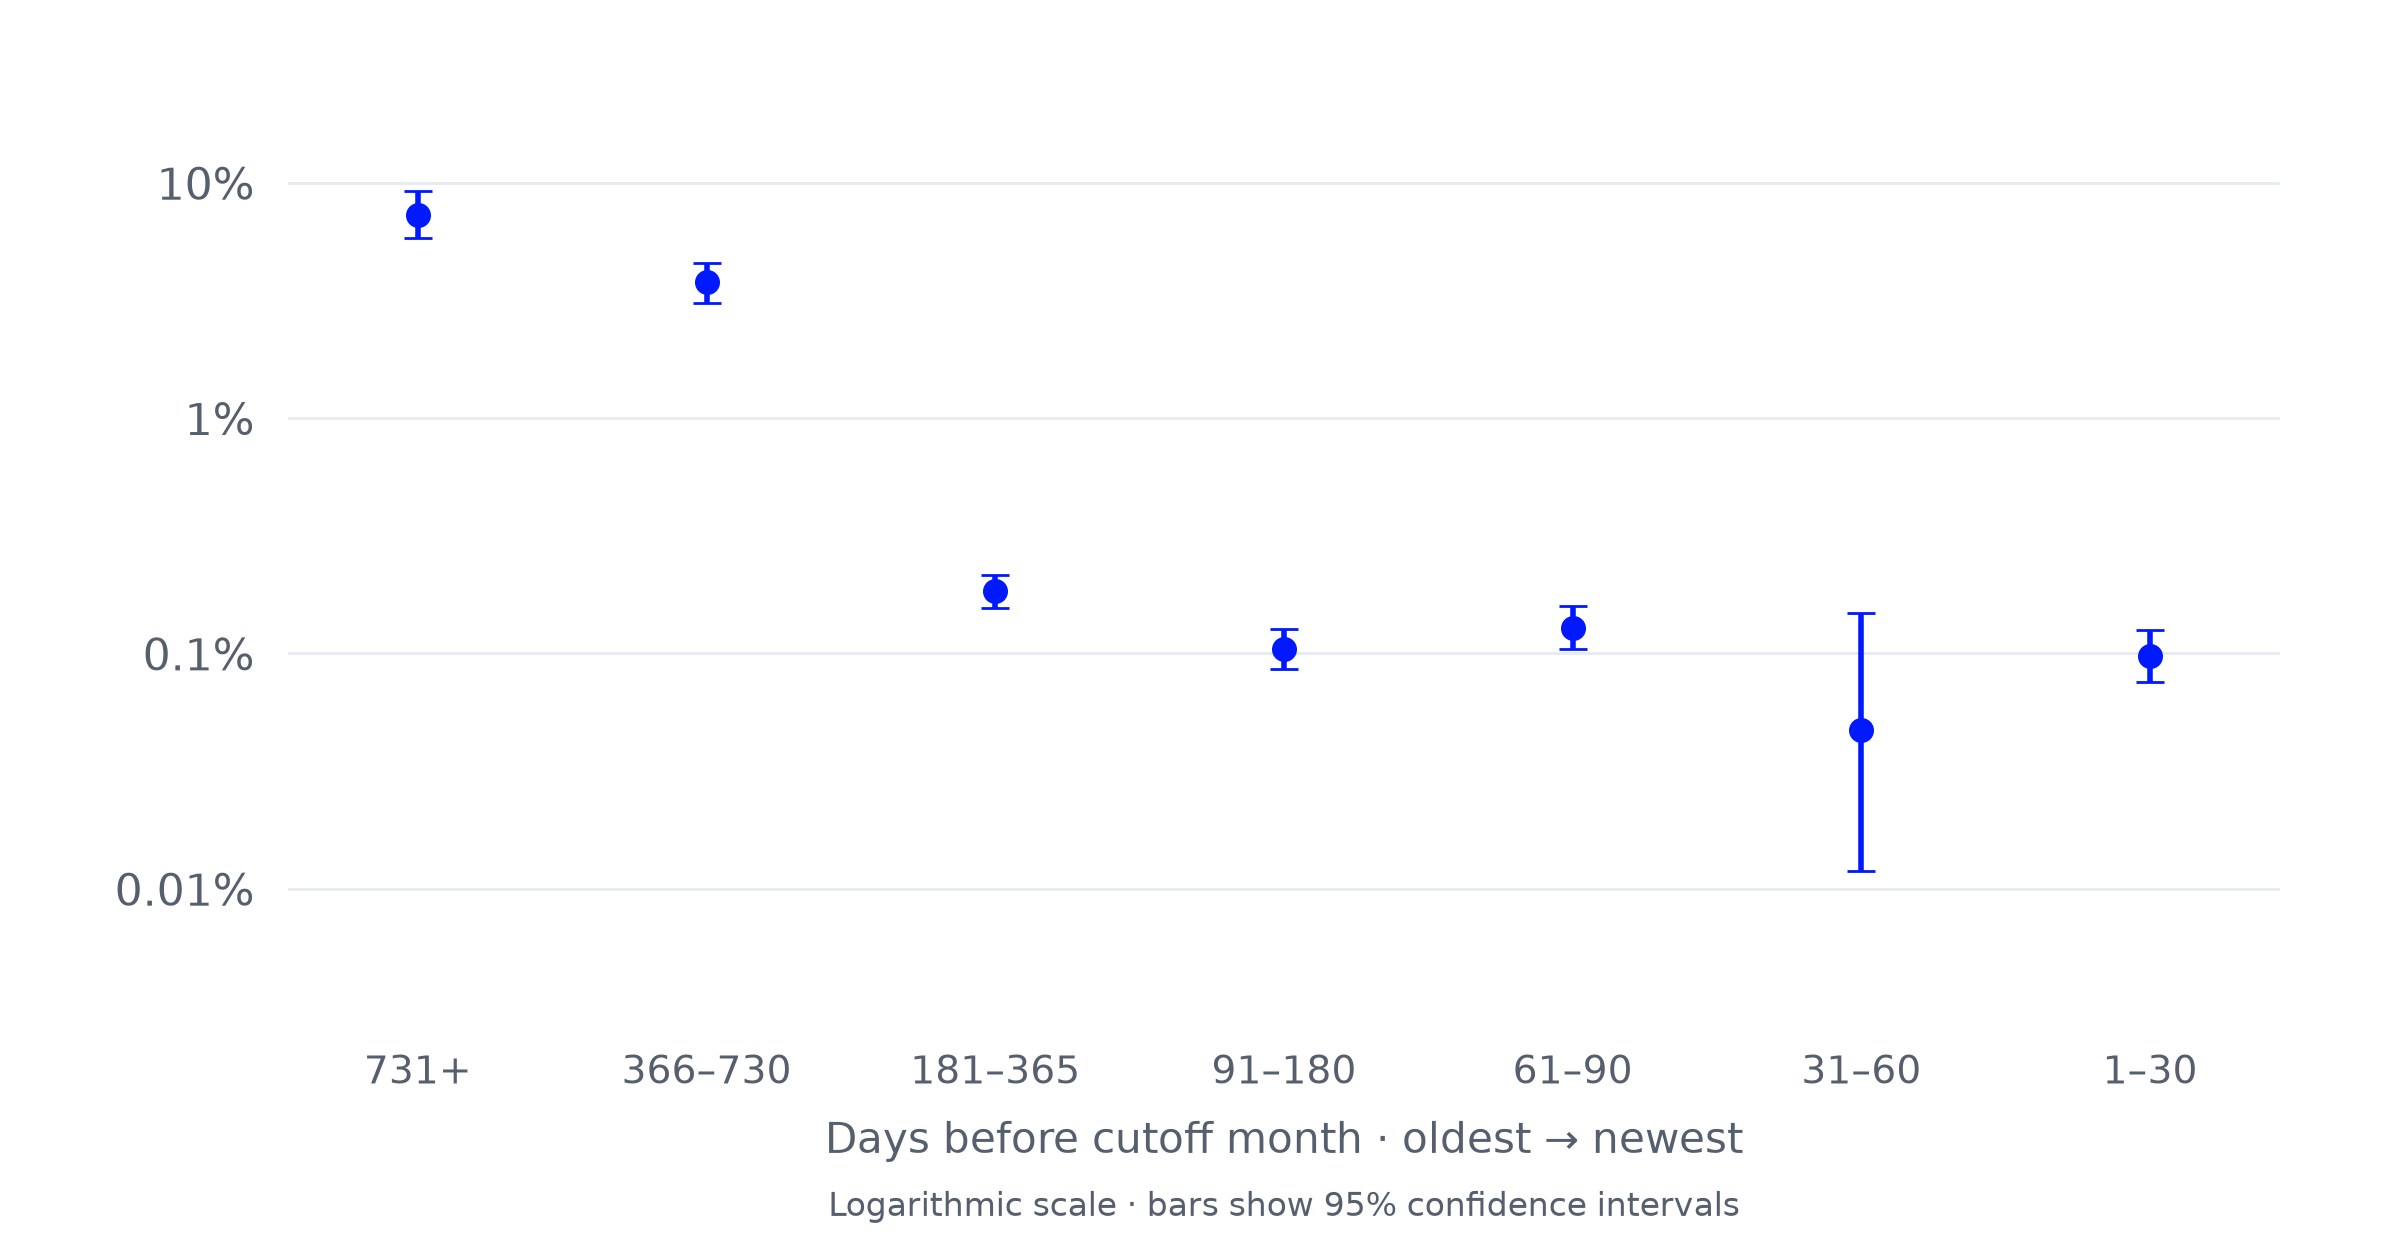
The chart shows the geometric mean probability of the correct answer. For example, the geometric mean of 1% and 9% is 3%. We average log probabilities within each company, then across companies, giving each company equal weight. Higher points mean the model assigns more probability to the right number, not that it answers more questions correctly. The scale rises in tenfold steps; lines show 95% confidence intervals.

Ultra assigns 0.10% probability to the correct answer in the final 30 days before its cutoff, 3.77% one to two years earlier, and 7.33% more than two years earlier. On this measure, the oldest earnings answers receive about 75 times as much probability as the most recent ones.
We also tried five different ways of asking for the earnings number. In a separate controlled comparison, Ultra showed the same overall pattern across all five: a probability advantage for pre-cutoff answers.

Ultra is also the largest model. It is tempting to attribute the result to size, but 30B Lightning also shows an age-related signal, while 120B Super has no clear trend after controlling for preferences for particular numbers. Size alone does not explain the pattern; training data and architecture differ too.
Compare this with asking Ultra to give the answer. In a separate test with short answers and thinking disabled, it recalled the exact EPS for just 2 of 272 events, even allowing five different prompts and counting any success. Scoring the known answer reveals a pattern that this recall test largely misses. That matters when choosing which historical events to use for post-training.
Memorization research looks beyond what a model produces on demand. In The Secret Sharer, Carlini et al. used model probabilities to measure how strongly models favored deliberately inserted training strings over alternatives. Our EPS probe follows that broad idea, but a probability advantage does not prove a release was in training: Duan et al. show that differences between older and newer data can also resemble evidence of training-set membership.
For post-training, this suggests that including an earlier earnings event need not be an all-or-nothing decision based on the cutoff date. How far back we go matters. Earnings from a few months before the cutoff may be less affected by prior exposure than earnings from years earlier. Measuring that signal could help us find more events to train on while retaining a capable starting model. These results make the recent pre-cutoff period worth investigating; they do not establish a memorization-free training window.
Explore the digits
Use the interactive demo below to see how Ultra assigns probabilities to the digits in the EPS answer 0.72. Select a digit to compare it with the alternatives, given the correct preceding characters.