Which S&P 500 utilities will actually profit from the AI data-center boom?
Answering that is real work: find every utility in the index, dig into each one’s data-center contracts, check them against grid forecasts, estimate how much new equity each one needs, and rank them all. Even with the best frontier models, our research agents were slow on requests like this, and their reports sometimes left out data without telling the user.
Smarter models with better tools don’t fix this on their own. One factor is the execution architecture. When a single model runs the entire research without a detailed research plan, it often leaves the work incomplete. In Samaya’s new third-generation harness (Gen 3), every request gets a detailed research plan, and code runs that plan instead of the model, so every step gets done as planned. Independent steps run in parallel, and each step gets a clean, focused context. Gen 3 is now live in production.
Compared with our previous harness (Gen 2), Gen 3 delivers:
- 2.6× faster median run time
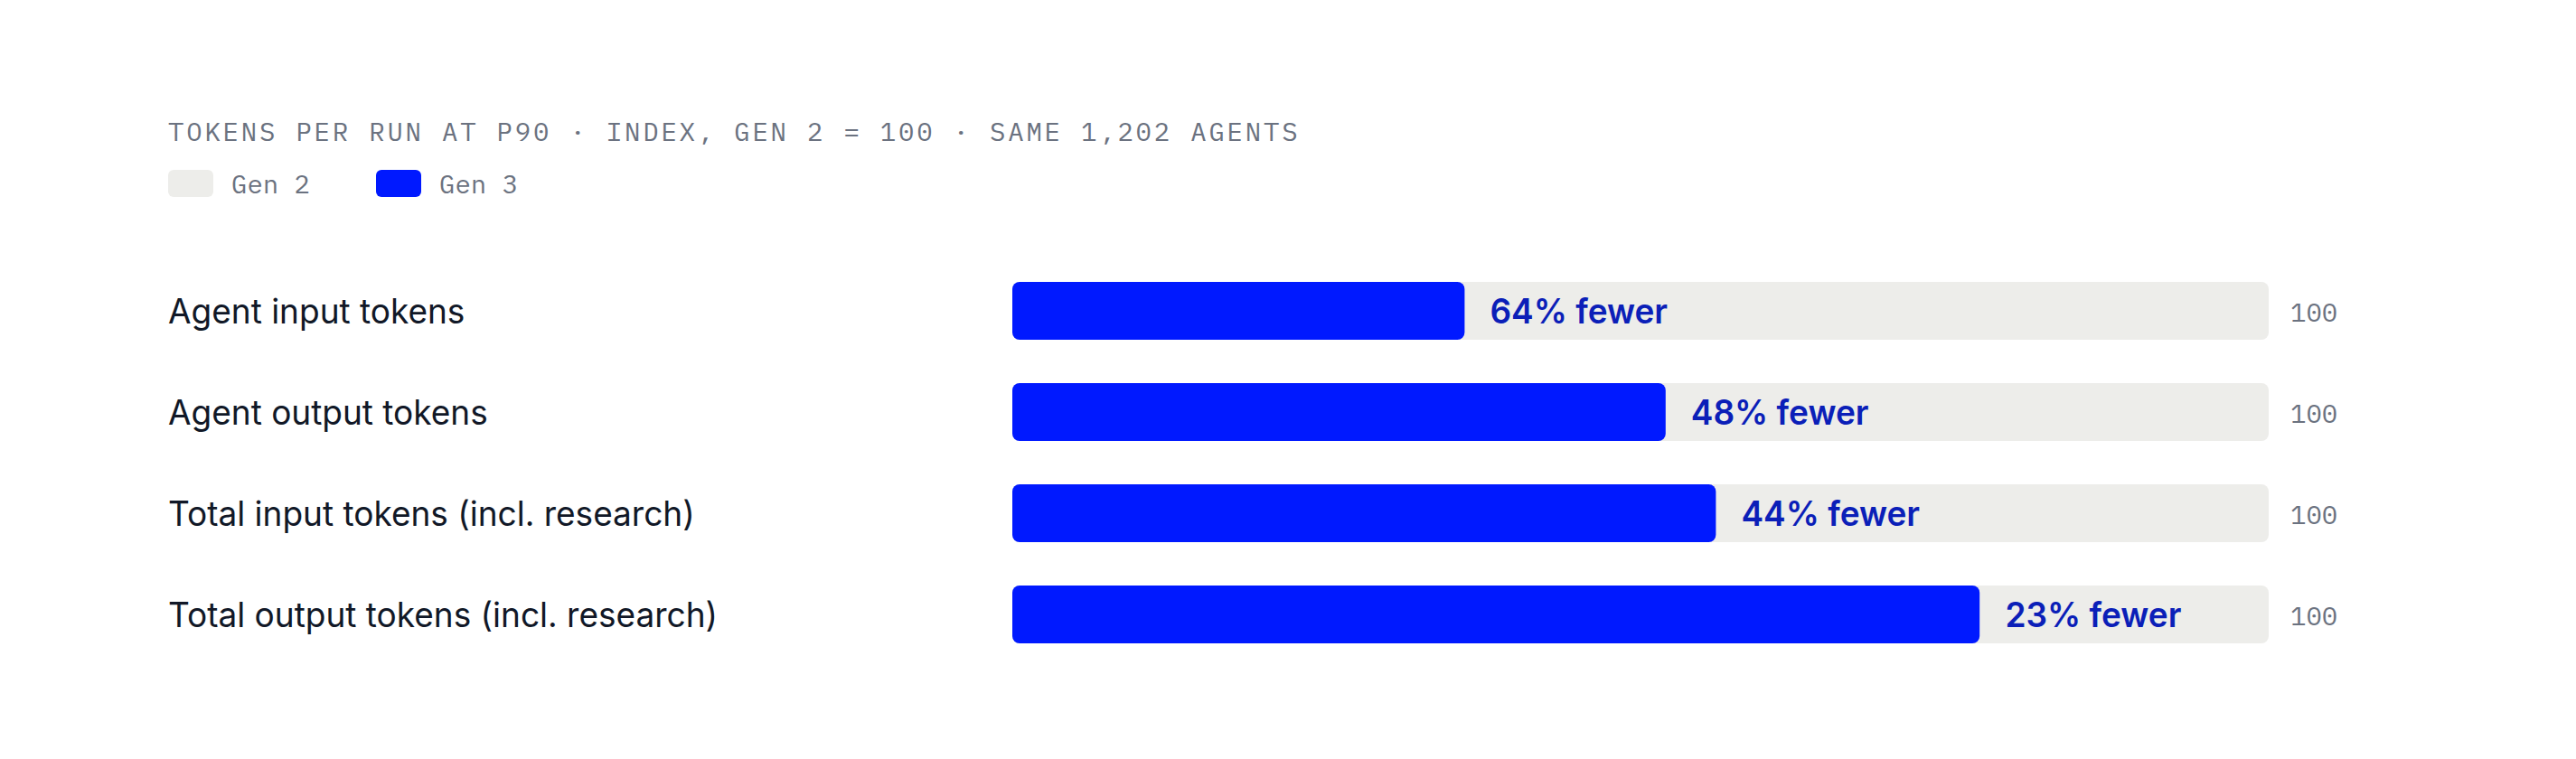
- 44% fewer input tokens at p90
- +4.9 points of rubric criteria met on FrontierFinance-220, about the gap between Claude Opus 5.5 and Claude Fable 5.1 on the public leaderboard
Compared with Claude Code connected to Samaya’s research tools, Gen 3 delivers:
- +5.7 points of rubric criteria met on the 71 hardest FrontierFinance-220 questions, both harnesses on the same model
- +17.7 points of checklist coverage on this post’s utilities question (92.2% vs. 74.5%), both harnesses on the same model and given the same query
Here’s how we built it.
Why long financial research is hard for agents
Frontier models and open-weight models are getting smarter and more capable of accomplishing complicated tasks. Even without being asked explicitly, they break down the objective into small executable steps, choose the right tools, and delegate the steps to subagents when it helps.
However, much of the financial research that Samaya’s power users run on a daily basis requires large-scale data gathering and analysis, and even the best models on the market struggle to run it on their own. Here is an example:
Which S&P 500 utilities actually benefit from data-center power demand?
For each one, find its disclosed contracted data-center load and its funded capex plan. Check each utility's load against its grid operator's regional forecast as a separate step, estimate each one's new equity need from its capex plan as another, then rank them using both.
To answer this request, the model needs to find the utility companies in the S&P 500, then run four research tasks per company: 1) finding its contracted data-center load, 2) finding its funded capex plan, 3) checking the load against its grid operator's regional forecast, and 4) estimating the new equity needed for the capex plan. Once all the data is gathered, it ranks the companies.
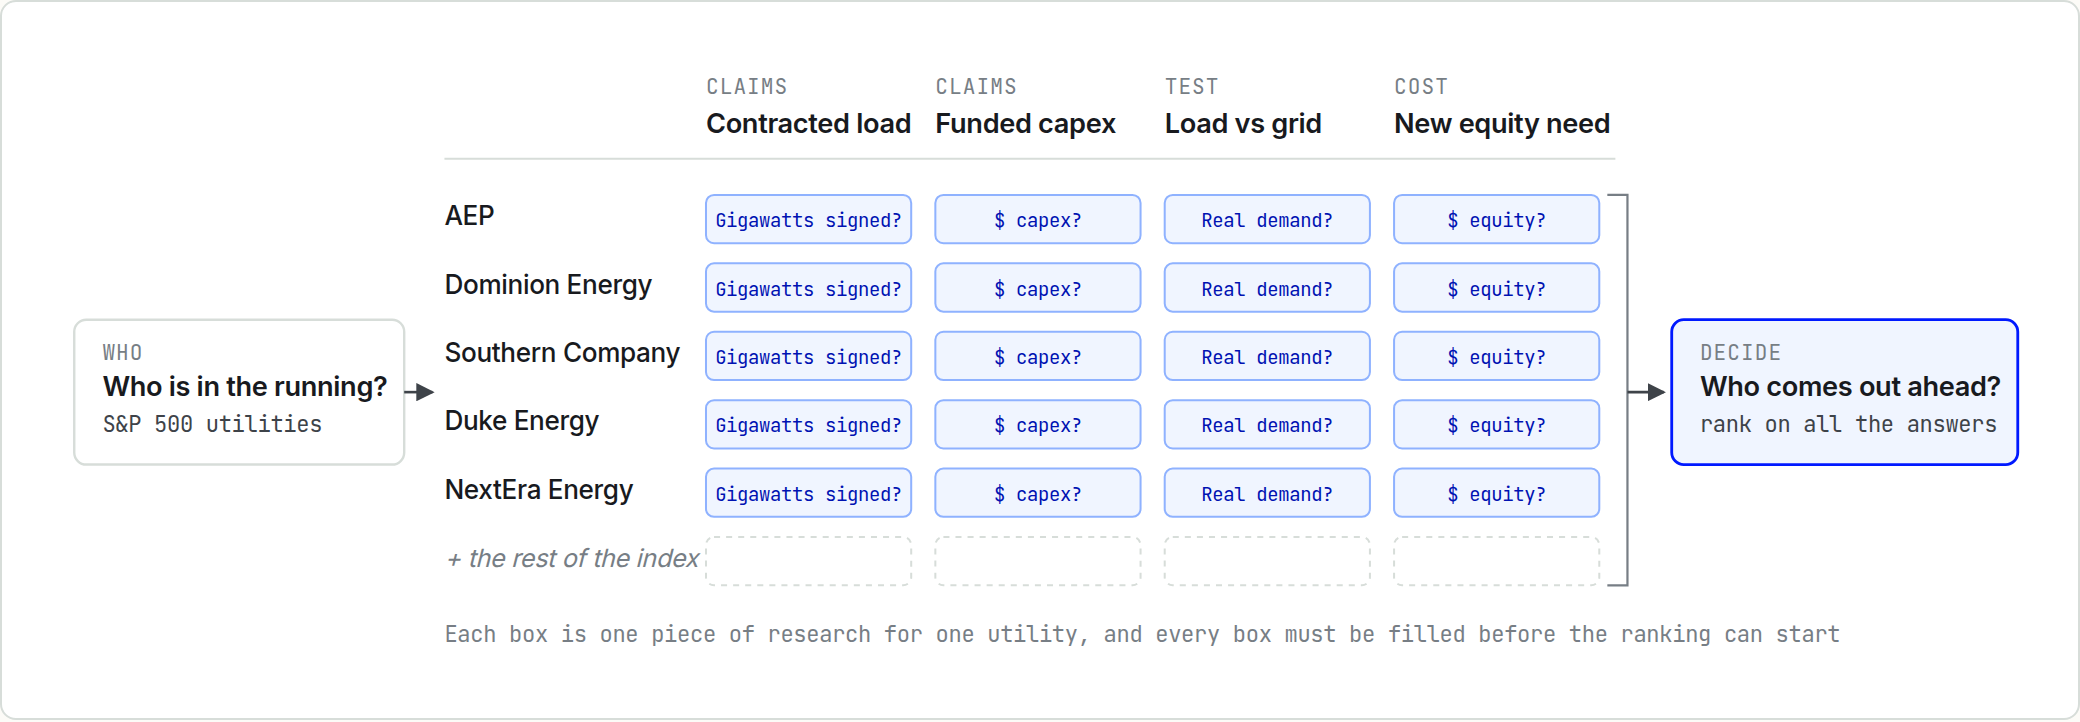
Models can handle each part of this request, but the whole request requires many data retrievals, tool calls, and reasoning steps. Along the way, the models sometimes give up partway through the research and return a result based on partial data. Also, because this task has to process a large amount of data, the model’s context grows, and execution gets slower and more expensive.
We see this even in our own products. Instant QA is Samaya’s product for quick, focused research questions, and it is fast and powerful. When we gave it the utilities request, it returned a polished answer in about five minutes. But the answer covered only about half of the utilities in the S&P 500. Nothing in the answer warned the user that the rest were missing. The missing ones included two of the ten largest utilities in the index: Sempra and Xcel Energy.
We also gave Claude Code the same research tools and the utilities question. It returned a polished report, but it decided up front that about a third of the utilities don’t benefit and skipped their research. That was a smart optimization the user never asked for, and it left out a quarter of the required data points. We look at this run in detail later.
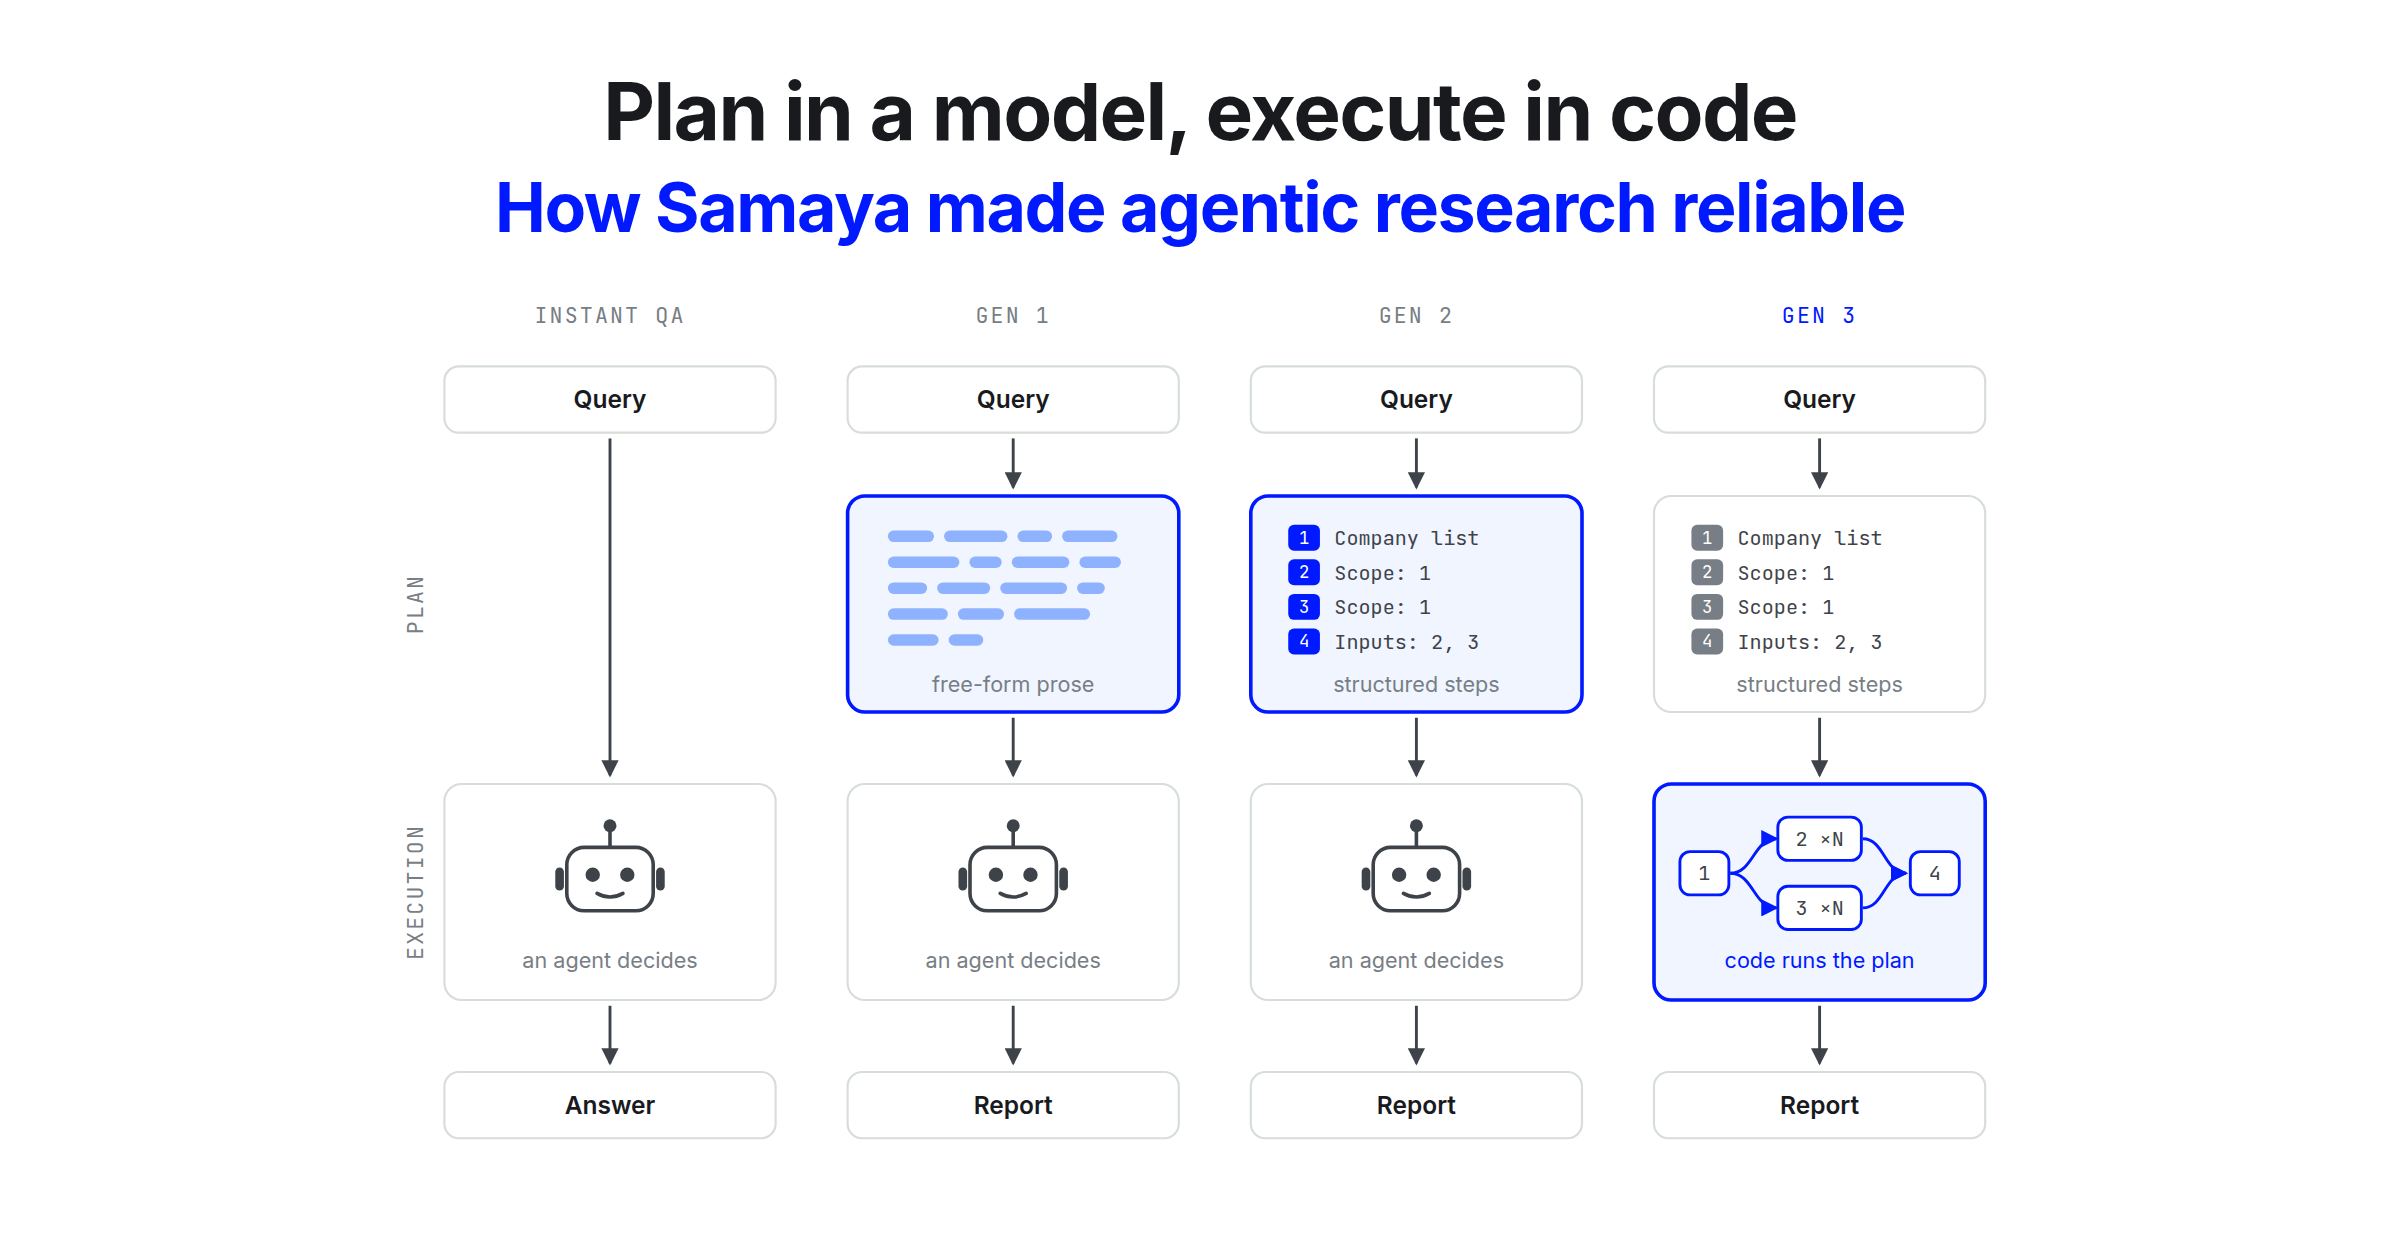
To support this kind of research, we built a dedicated research agent platform where users create a research plan with our planner agent and then run it. We have improved it steadily since 2025.
The first generation ran plans written in free-form prose. They were flexible, but the results changed from run to run, which was a critical problem for users who needed consistent results.
To address this, we introduced a structured plan that defines research steps as a Directed Acyclic Graph (DAG). This second generation of the research agent let our users instruct the research agents more precisely, and it improved the consistency of the research trajectory during execution. It also let us run each step as a subagent, so each step ran in a clean context. Consistency of the step executions improved a lot, but the research agents still took shortcuts or skipped steps in the plan. For example, a Gen 2 agent asked to track news for about 2,000 companies covered only about 240 of them, and wrote its report from that limited data without telling the user.
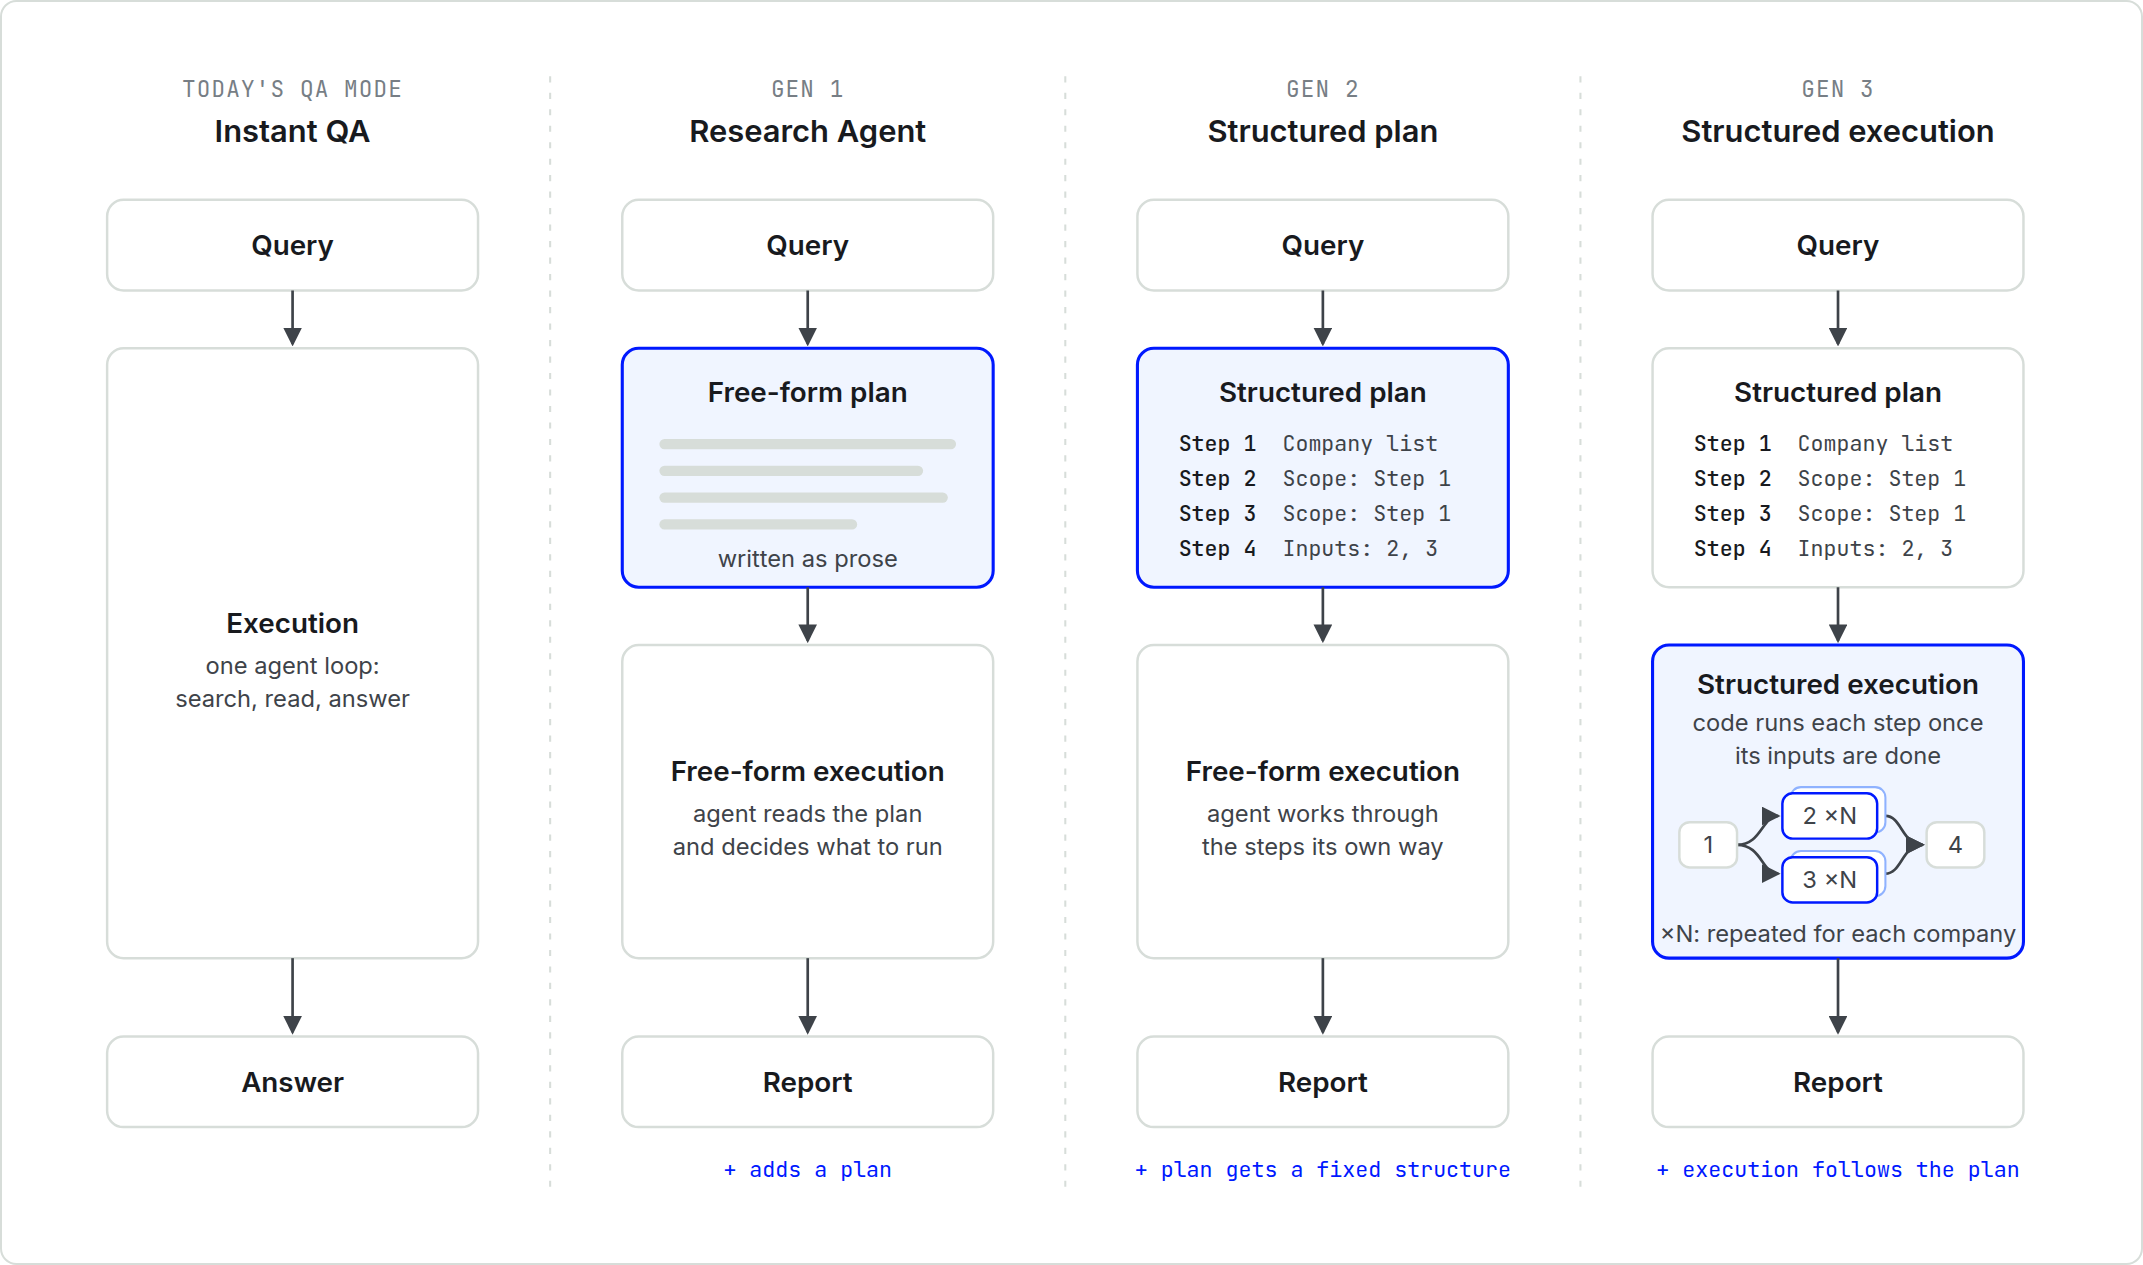
Also, because the entire execution was managed by a single main executor agent, executions took a long time (31.9 min at p90) and consumed an enormous number of tokens (17.54M input tokens at p90, including the research tool calls).
To fix these problems, we designed a new plan execution harness.
How the Gen 3 harness works
The inconsistency and slowness came from the main executor agent. It was designed to execute users' plans as written. But it was a language model, so it sometimes made its own choices, such as skipping steps or taking shortcuts the plan did not ask for. That freedom made sense in Gen 1. The free-form plans were sometimes vague, so the executor had to fill in the gaps. In Gen 2, the structured plan gave the model clear direction for the research, and following the plan exactly became more important than making its own choices. Flexibility now belongs in planning: the planner agent shapes the plan for each request, and the user can edit it before it runs. The executor's job is to follow that plan exactly.
For this reason, Gen 3 replaces the main executor agent with code. The code-based executor reads the plan and starts each research step as soon as the steps it depends on have finished, so independent steps run in parallel. Each step saves its results to a shared sandbox, where later steps and the report writer agent read them. Without the main agent in the loop, runs are faster and use far fewer tokens.
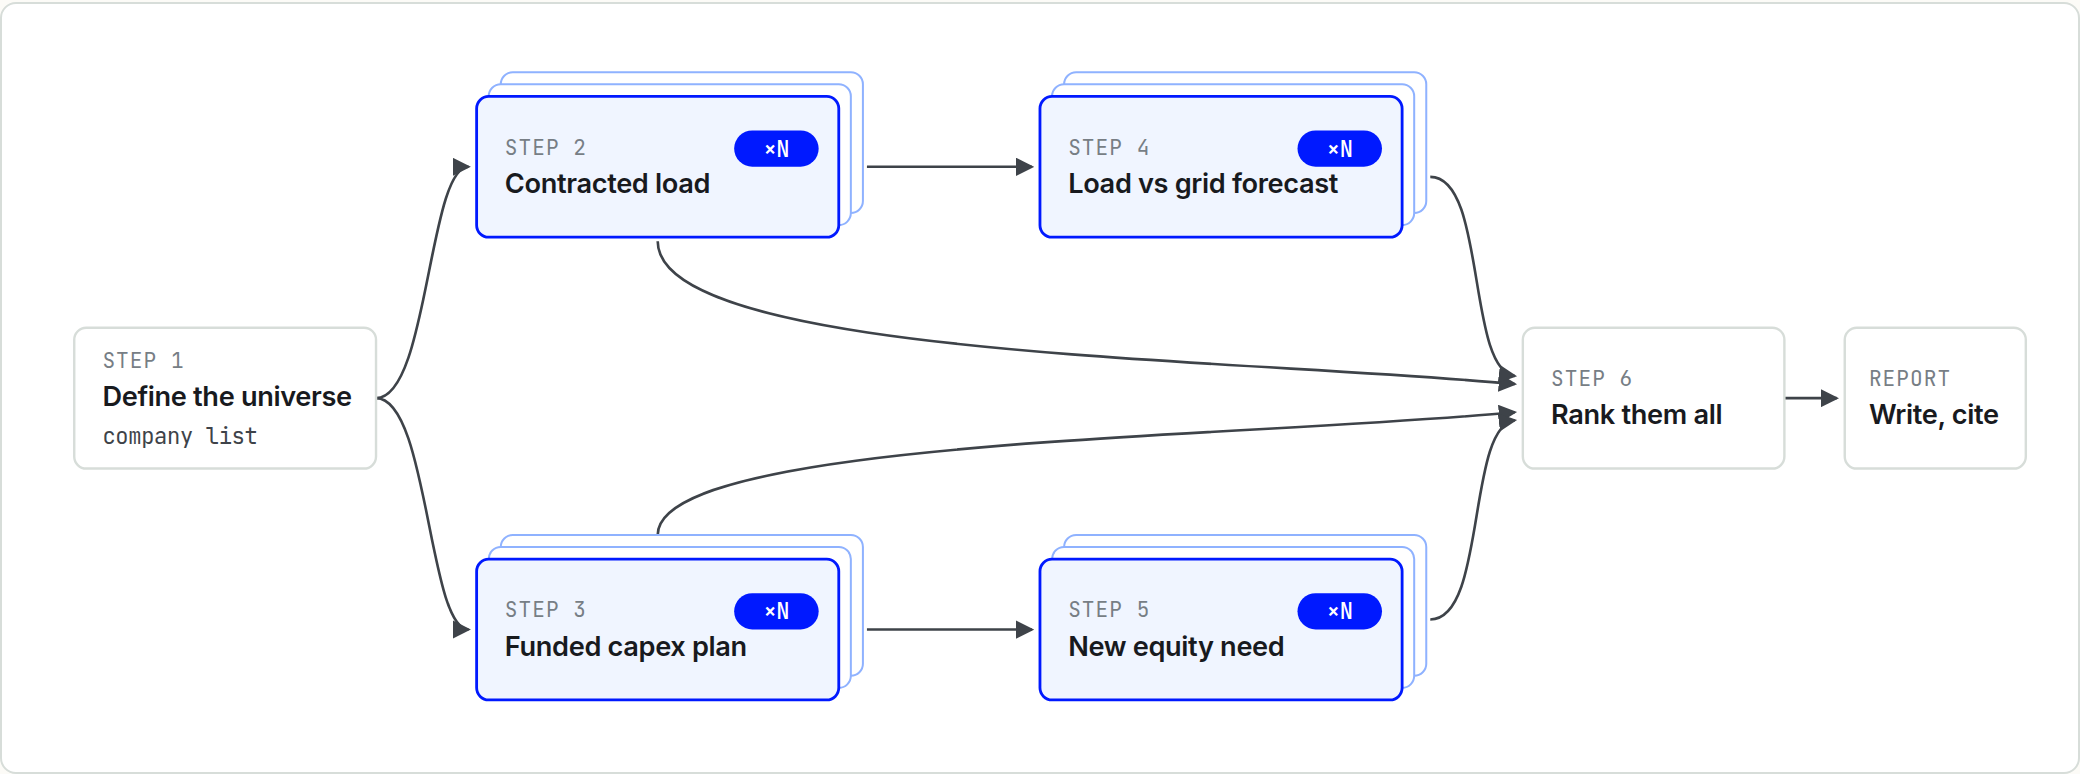
As an additional benefit of this design, we now have more granular control over each research step. In Gen 2, the system and user prompts for the step executor subagents were generated dynamically by the main executor agent, but now they are fully controlled by our code-based executor. This lets us adjust instructions more precisely.
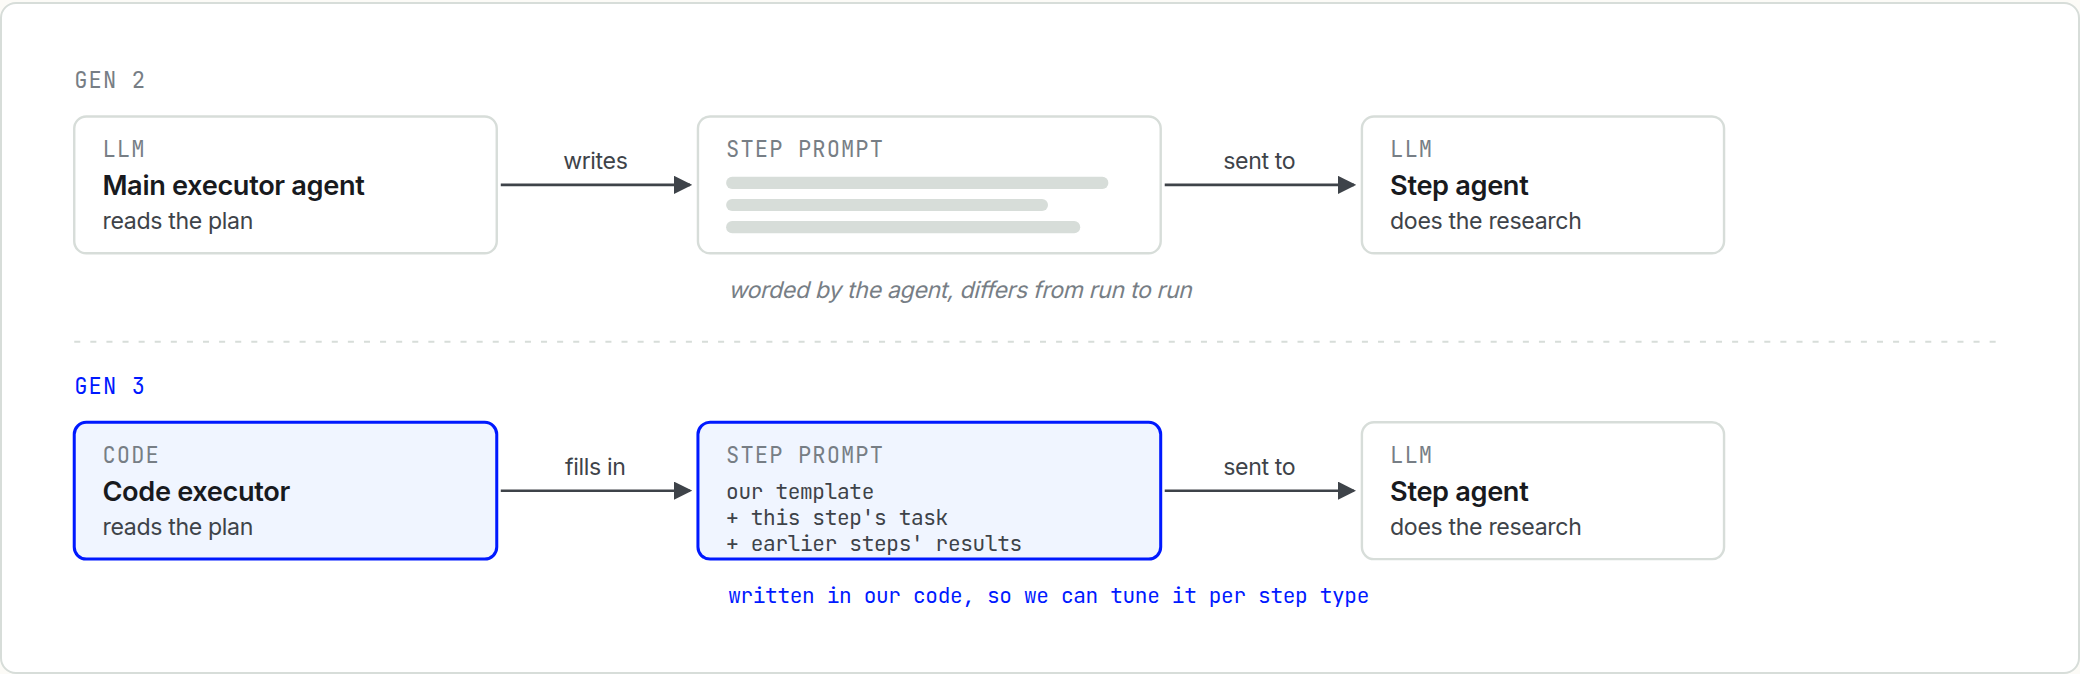
This design even lets us replace some research steps with code. One example is the document sweep step. In Gen 2, the research step agent retrieved all related documents for a query. However, when the query covered a wide range of data (e.g. checking all Morgan Stanley research reports issued last week), the agent struggled despite well-designed tools. To do this more efficiently, we replaced the step with a code step that looks up all the reports by their metadata and filters them in two passes: a fast, low-cost model removes clearly irrelevant reports, then a stronger reasoning model checks the rest.
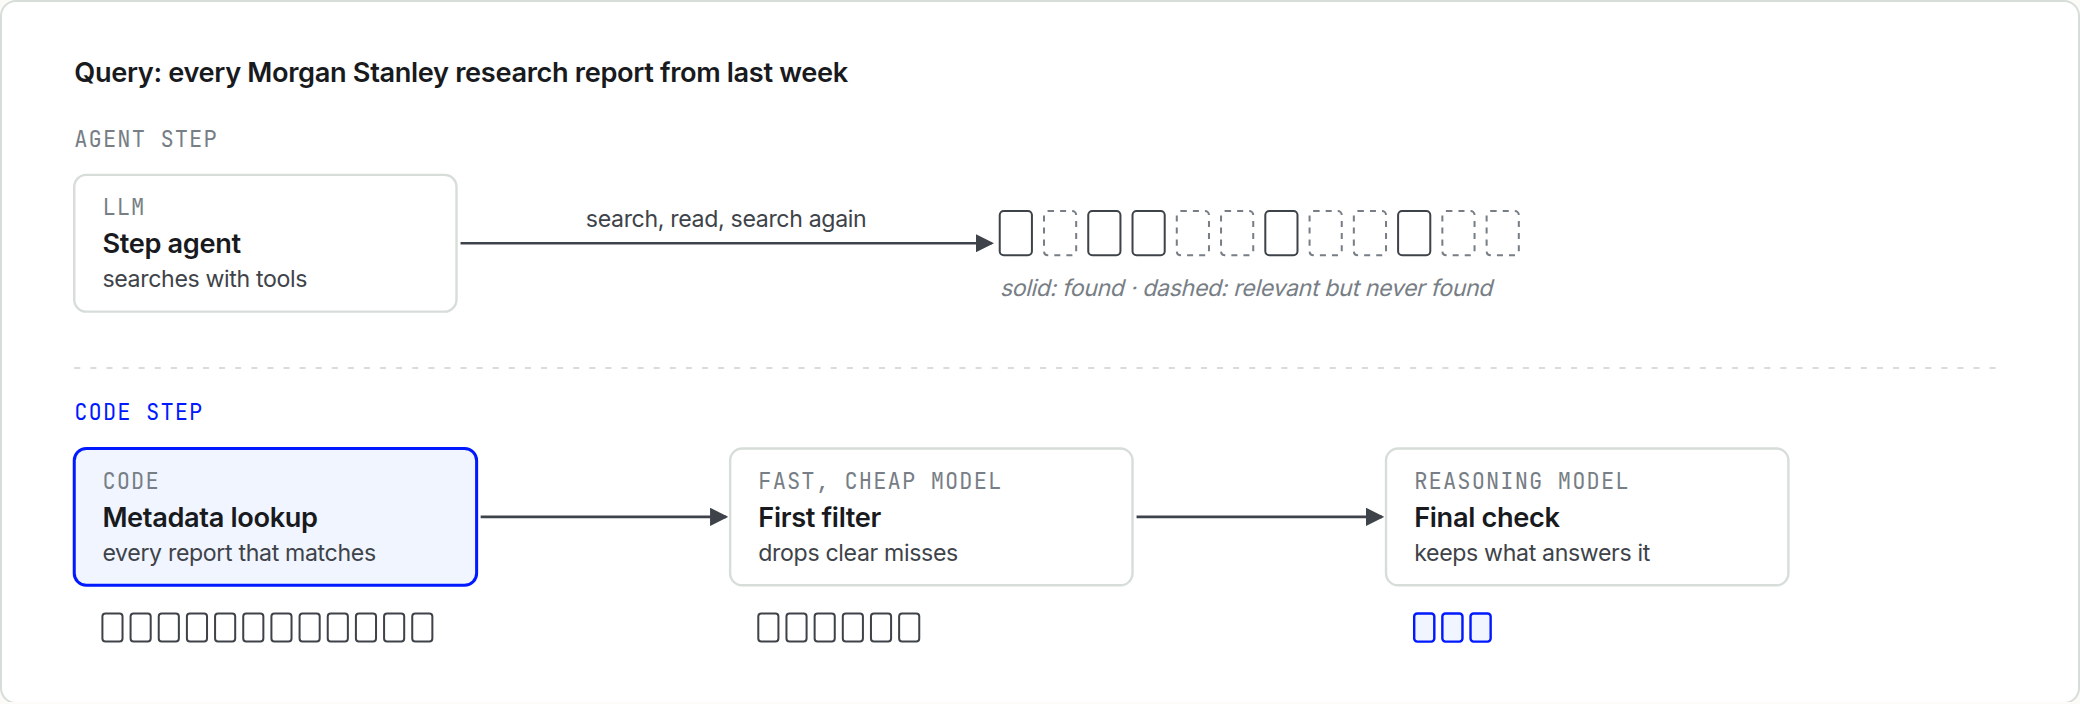
We tuned each of these optimizations by analyzing traces against a broad eval set. Here is what they added up to.
Results
Before and after the harness migration, we measured the speed and token consumption of 1,202 scheduled and event-triggered agents that executed the same research plans, and compared the results. We measured quality separately on FrontierFinance-220, on 51 research queries from our internal evaluation set, and on 200 production agents.
2.6× faster execution
The Gen 3 harness greatly improved execution speed thanks to parallel steps and faster code steps. The median execution time was 15.2 minutes before the migration and 5.9 minutes after, about 2.6× faster. At p90, the time fell from 31.9 minutes to 16.7 minutes, about 1.9× faster.
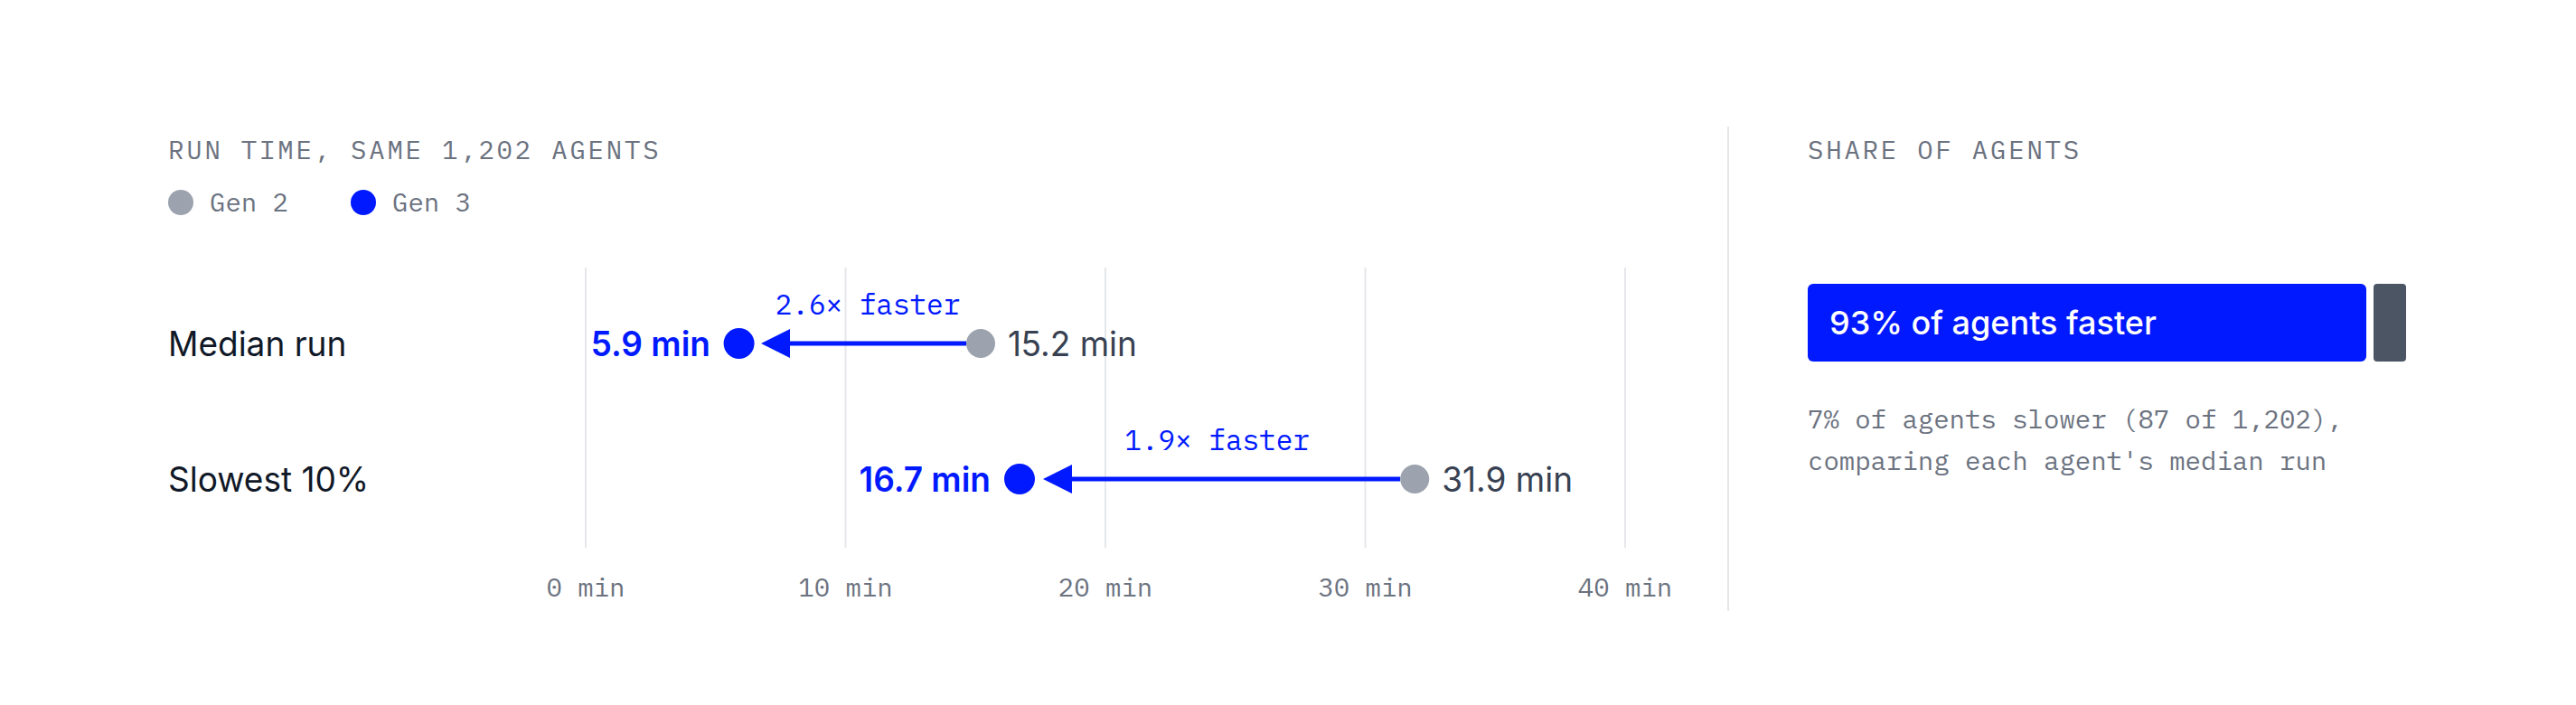
In total, 93% of agents finish their work faster with the Gen 3 harness. Most of the rest are only slightly slower (under three minutes). The biggest slowdowns come from agents that track lists of hundreds to over 2,000 companies: Gen 3 now researches every company on the list, where Gen 2 often covered only part of it.
Better execution quality
FrontierFinance-220 is our public benchmark of 220 financial research questions, each graded against a checklist of facts a good report should contain (11,516 criteria, 7,461 marked essential). We ran Gen 2 and Gen 3 on the same 220 research plans, generated once and reused, so the plan was identical and only the execution differed. Each harness ran with its production configuration. Three judge models from different providers graded every report.
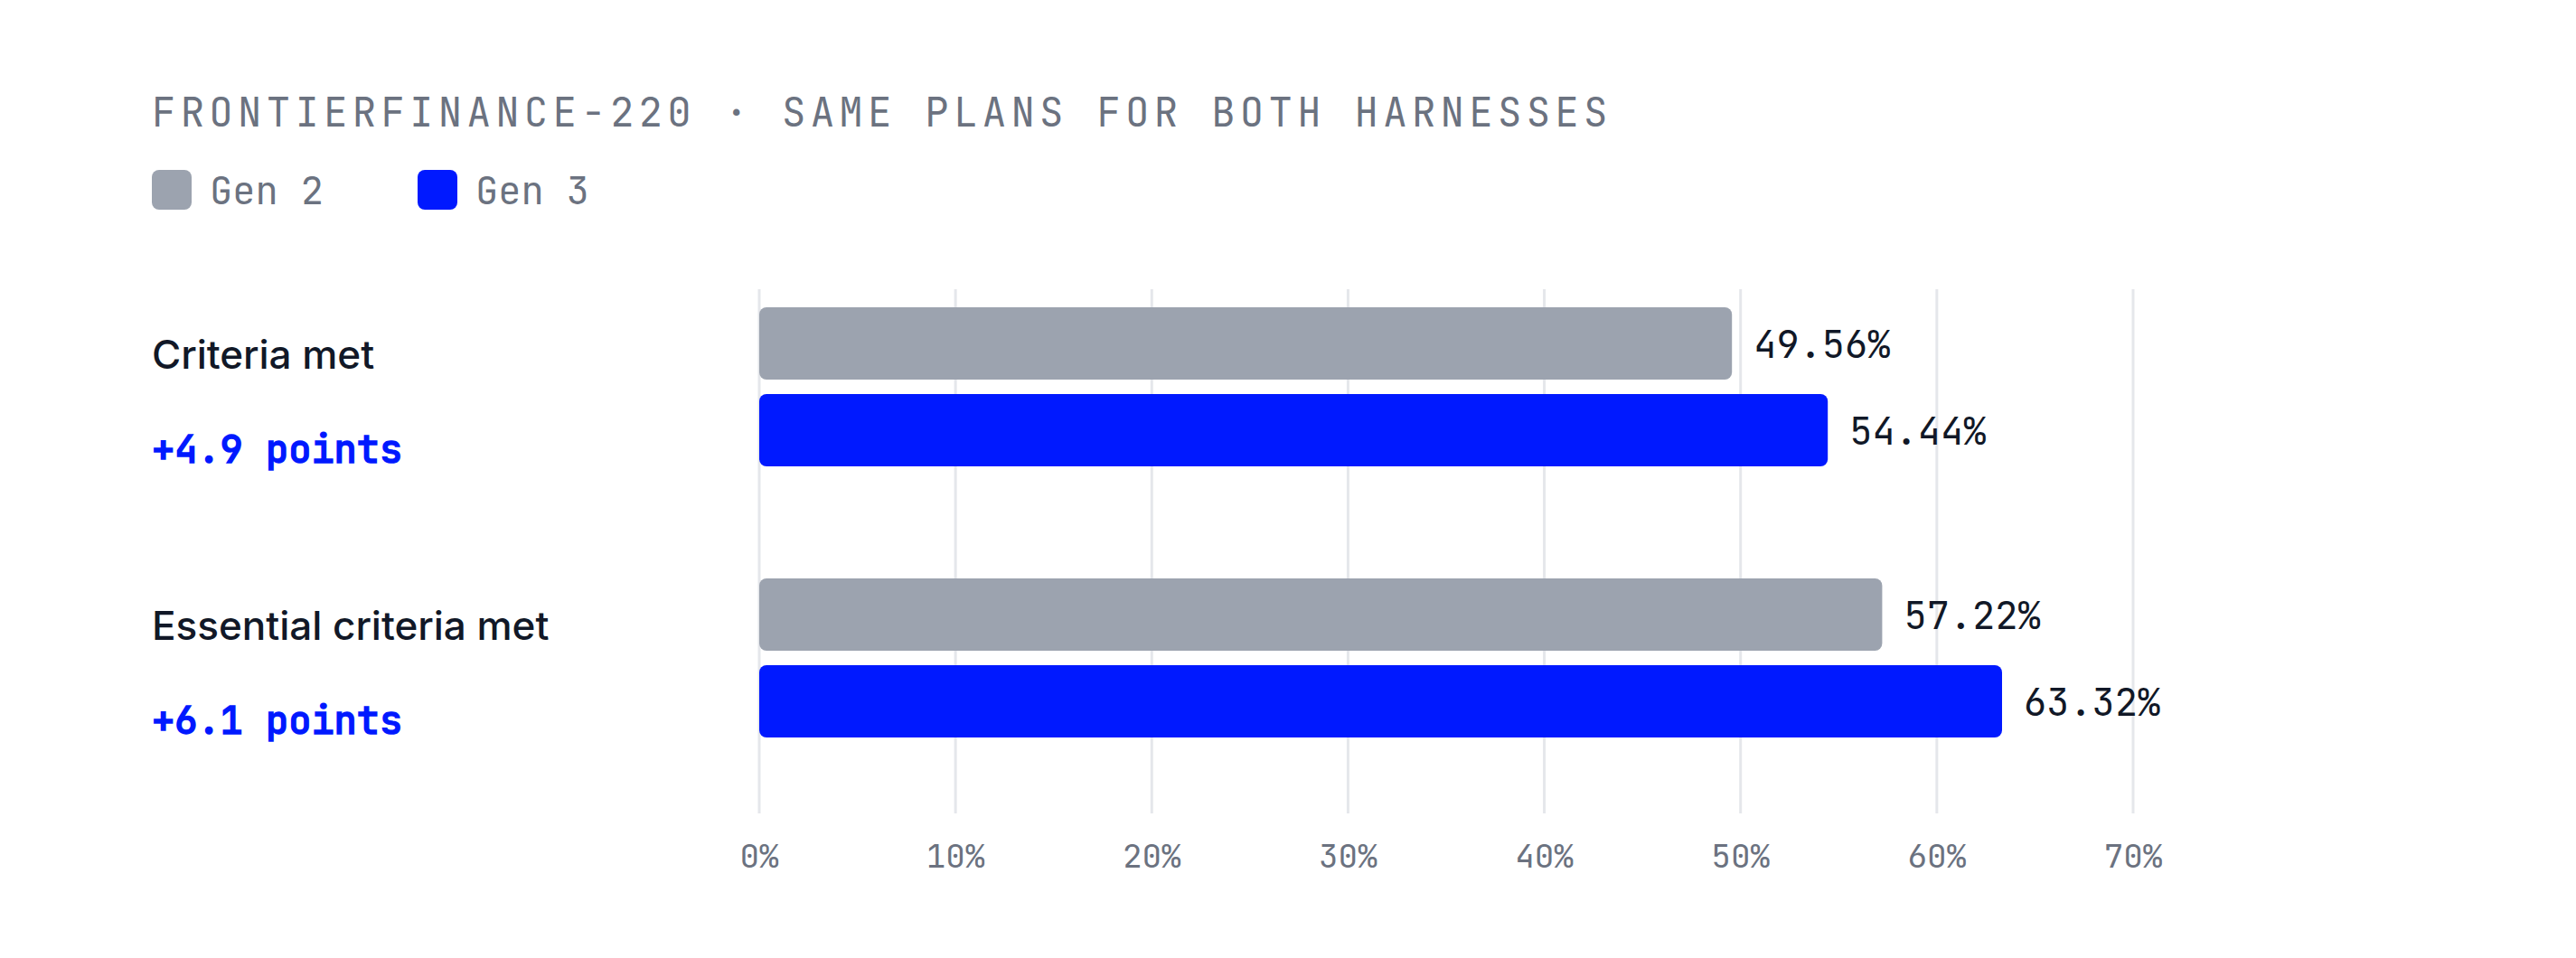
For scale, 4.9 points is about the gap between Claude Opus 5.5 (50.9%) and Claude Fable 5.1 (55.9%) on the public FrontierFinance leaderboard.
The gains were largest where the plan asked for complete, period-by-period data: financial data and modeling (+10.8 points), earnings and events (+10.0), and research that has to cover every period in a range (+8.7). On open-ended sector and macro questions, the two were about even.
We also compared reports head-to-head on 51 research queries from our internal evaluation set. Two judge models compared each pair blindly on the following viewpoints:
| Viewpoint | Question to judge |
|---|---|
| Completeness | Which report better addresses all points in the outline and query? |
| Instruction following | Which better follows specific constraints (dates, ticker lists, format requirements, scope)? |
| Accuracy | Which has more reliable, internally consistent data? |
| Citation quality | Which has better-sourced, more valid claims? |
| Table quality | Which has more complete, accurate tables (if applicable)? |
| Clarity | Which is better structured and easier to read? |
| Cleanliness | Which is free of internal scaffolding, prompt leakage or artifacts? |
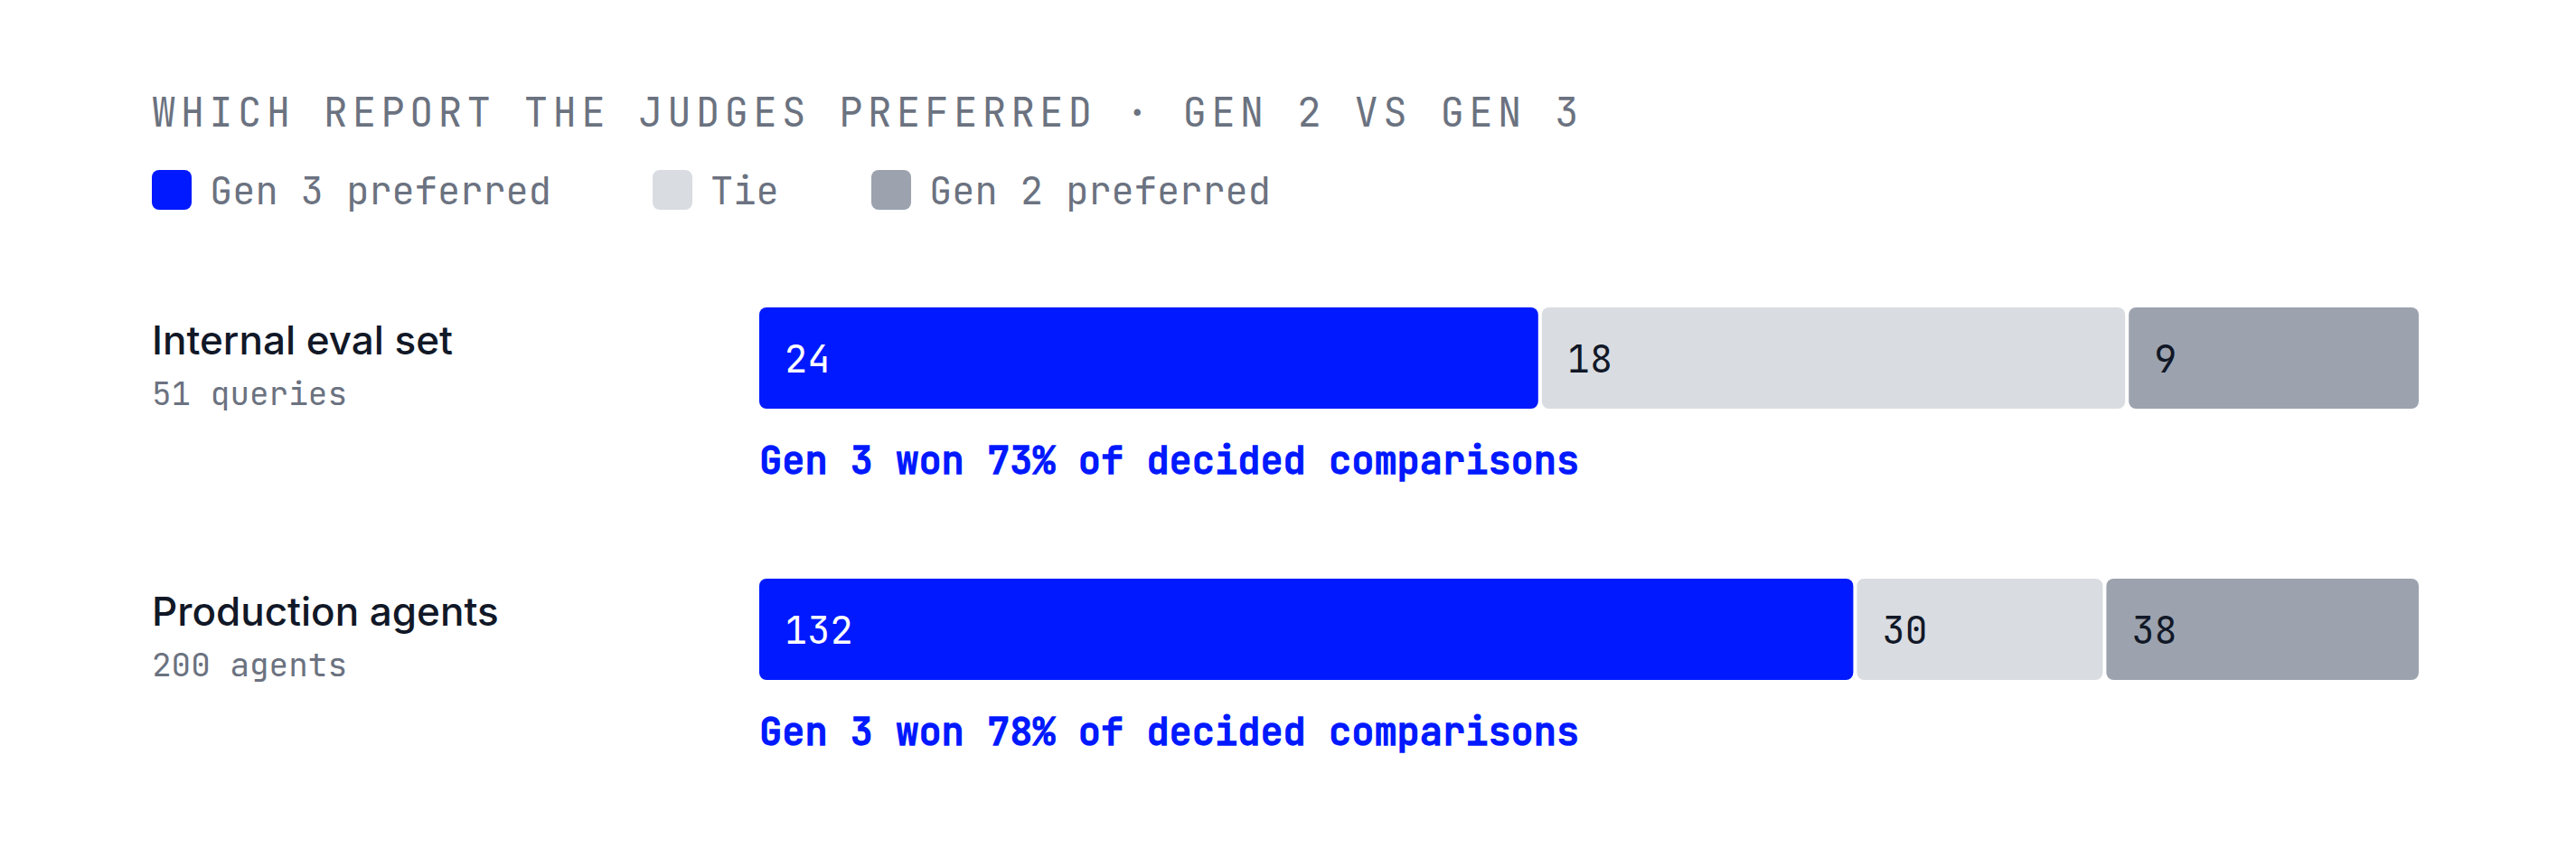
The result was clear: Gen 3 won 24 of the 33 queries that were not ties (73%).
We also checked this in production. For 200 randomly sampled saved agents, we compared a report from before the migration with a report from after it, using the same judges. Gen 3 was preferred in 132 cases and Gen 2 in 38, with 30 ties (78% of decided comparisons).
More token-efficient
Input tokens make up most of the tokens our agents process, and Gen 3 reduced them substantially. With the main executor agent gone and the research steps optimized, agent input tokens at p90 fell from 11.11M to 3.98M, a 64% reduction. Total input tokens also fell from 17.54M to 9.77M, a 44% reduction.
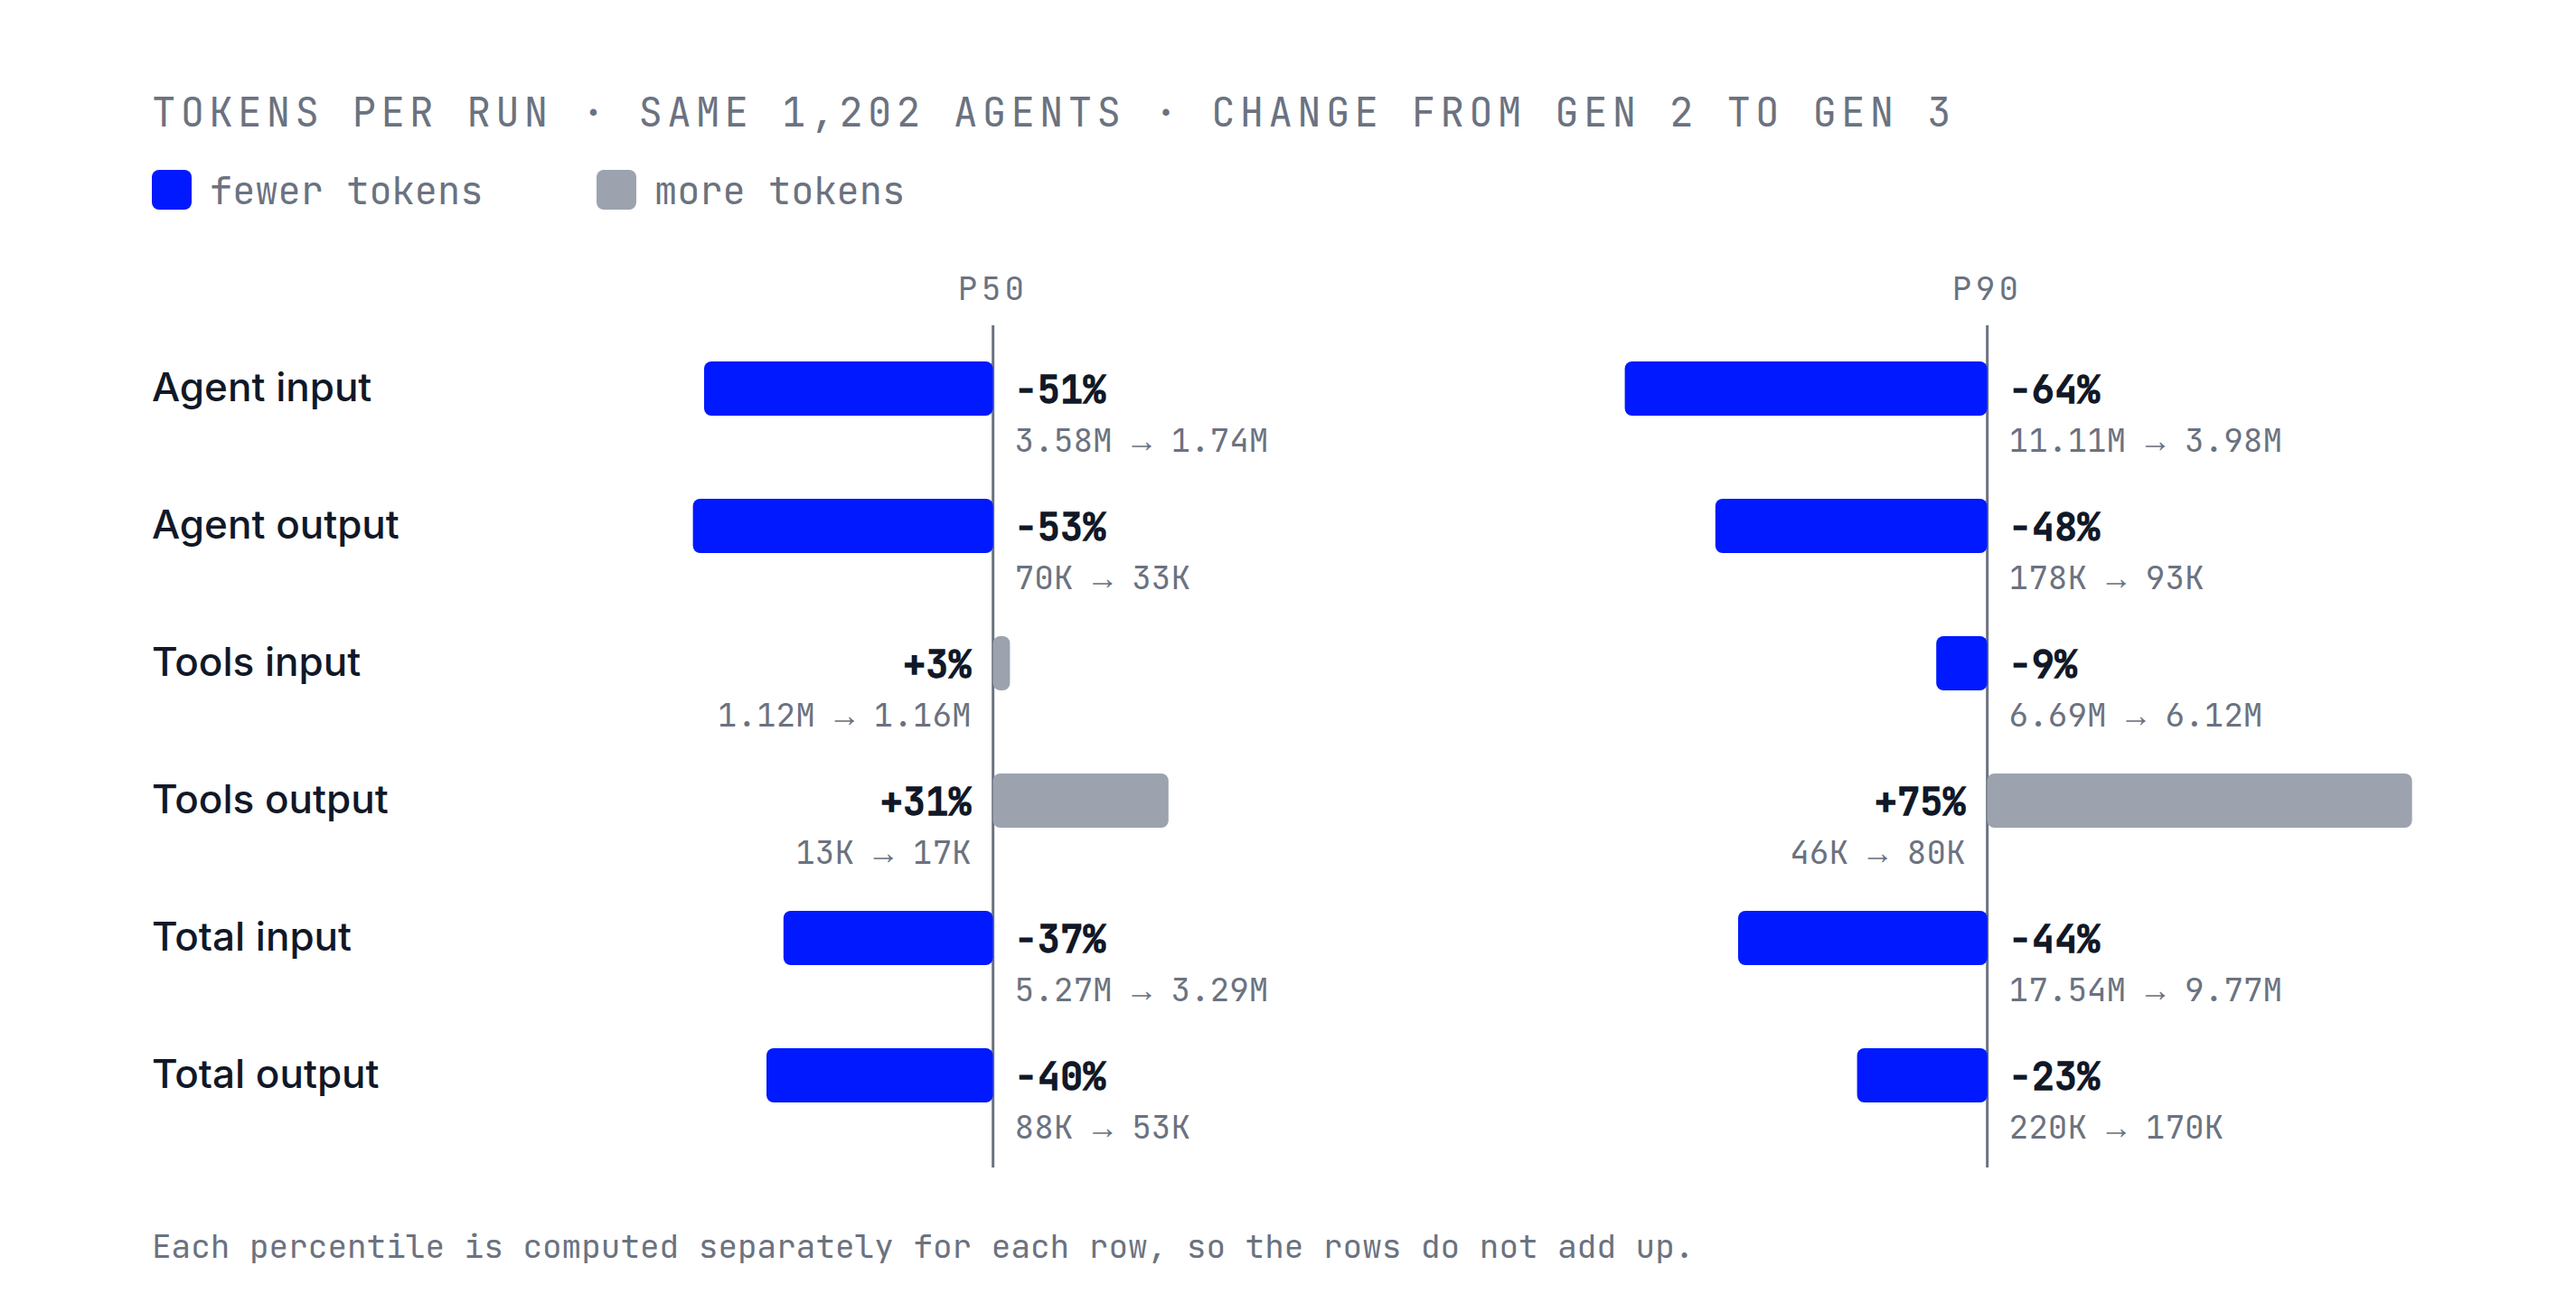
- Agent tokens: the research step agent’s own model calls.
- Tools tokens: the model calls in research tools called by the research step agent.
- Each percentile is computed separately for each row, so the rows do not add up.
Comparison with Claude Code
A question we often hear: with models this capable, couldn’t you just connect a general-purpose agent like Claude Code to Samaya’s research tools? We tested exactly that, running Gen 3 and Claude Code with the same model and the same tools.
For an apples-to-apples comparison, we use Opus 5.5 as the main model in each harness.
We used two evals for this comparison.
- Run the 71 hardest queries from FrontierFinance-220 in each harness. We selected only the hard queries to make the differences more visible.
- Run the S&P 500 utilities question above in each harness and score each report on a 128-item checklist: 4 checks per company (124 data points) plus 4 checks on the steps and the ranking the question asks for.
FrontierFinance Hard
Gen 3 got +5.7 points on overall criteria and +2.9 points on essential criteria.
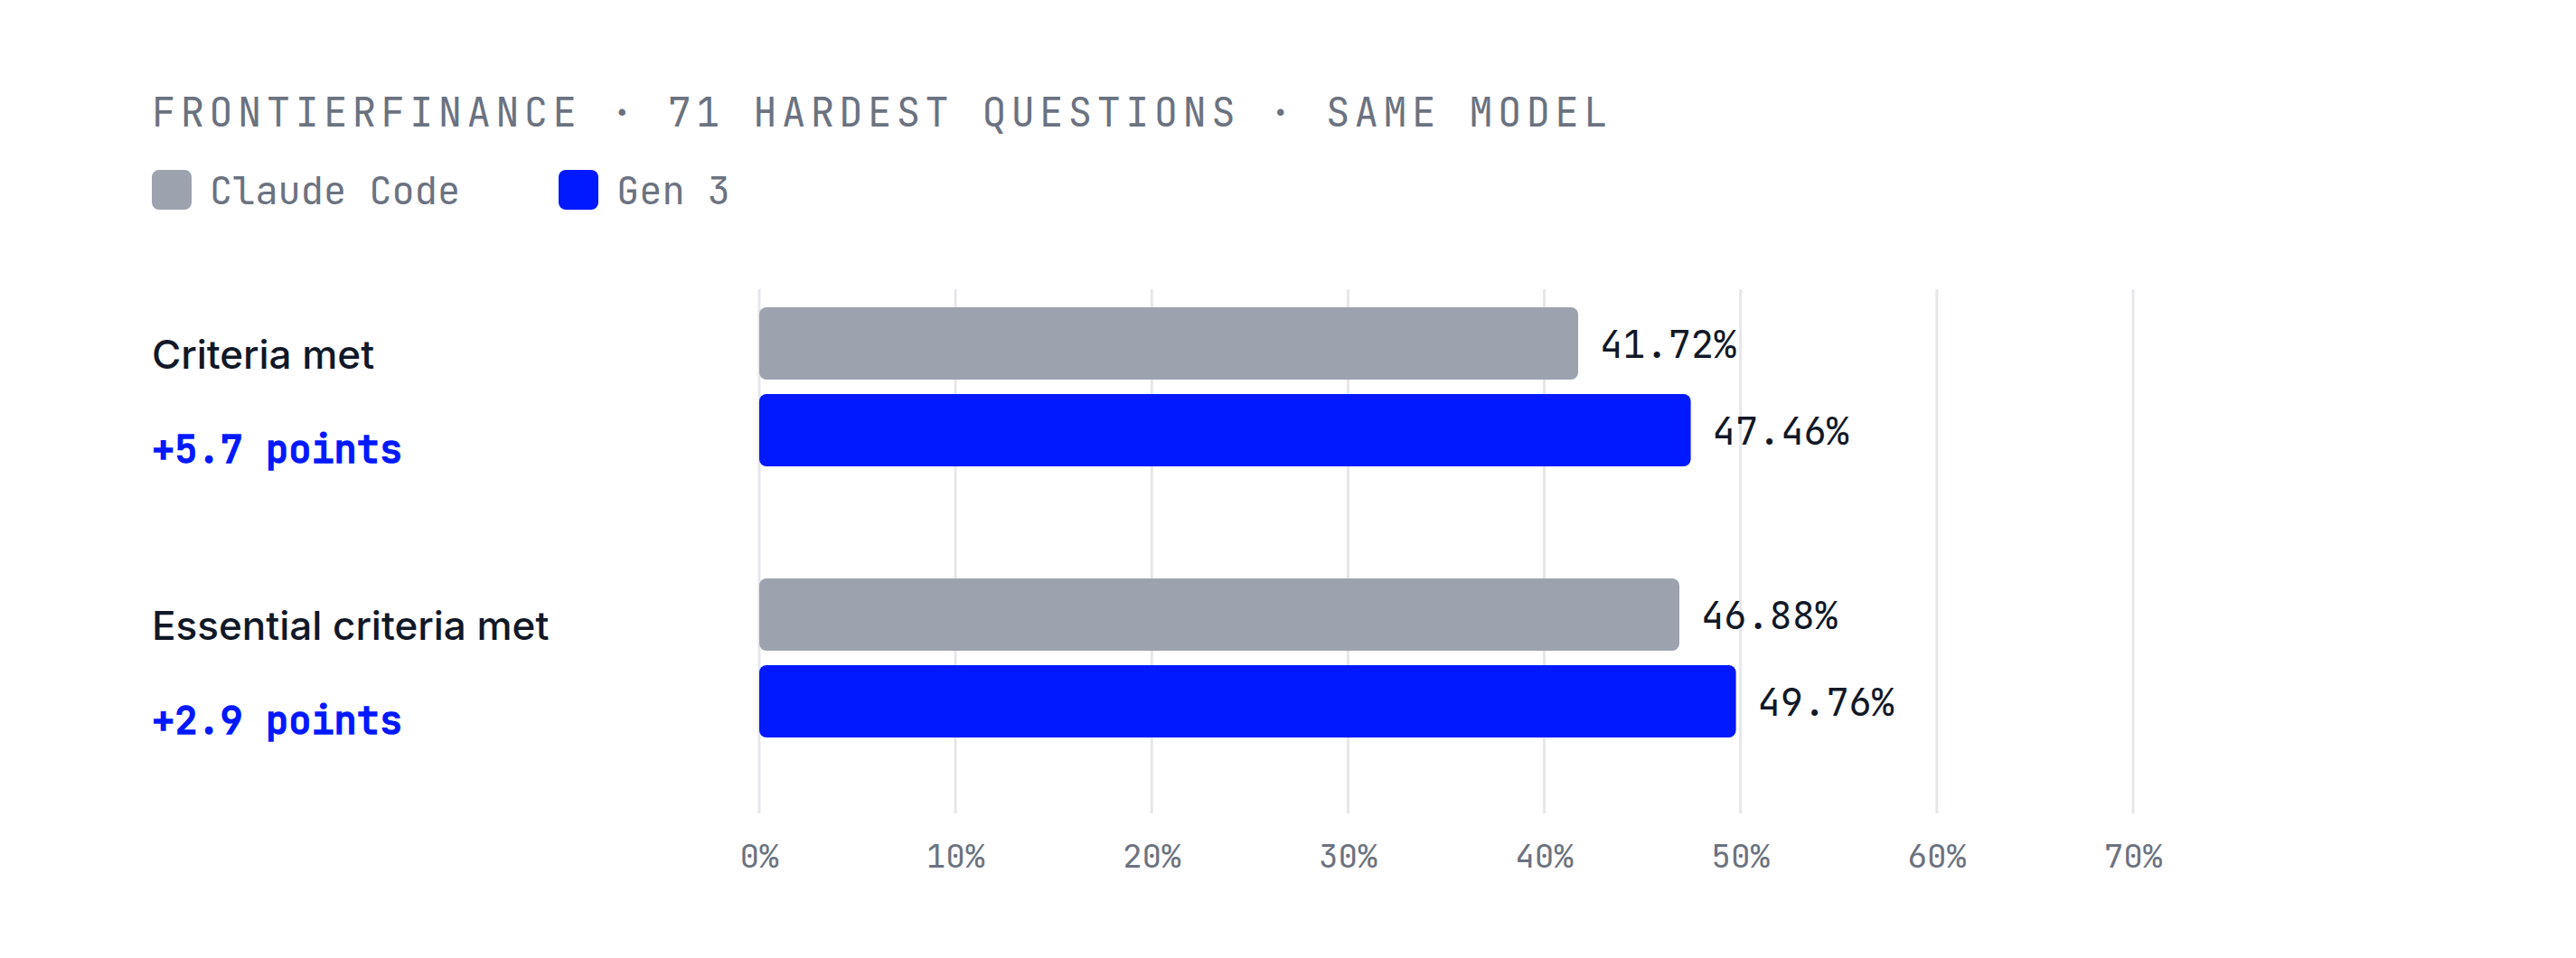
Both harnesses used the same model, so the difference comes from the harness. Gen 3’s planner turns each query into a plan that covers everything the question implies, and the executor runs every step of it. Most of the gain is in the supporting criteria, which reward that kind of breadth.
The S&P 500 utilities question
Averaged over three runs, Gen 3 covered 92.2% of the checklist items and Claude Code covered 74.5%. The figure below shows where each harness fell short.
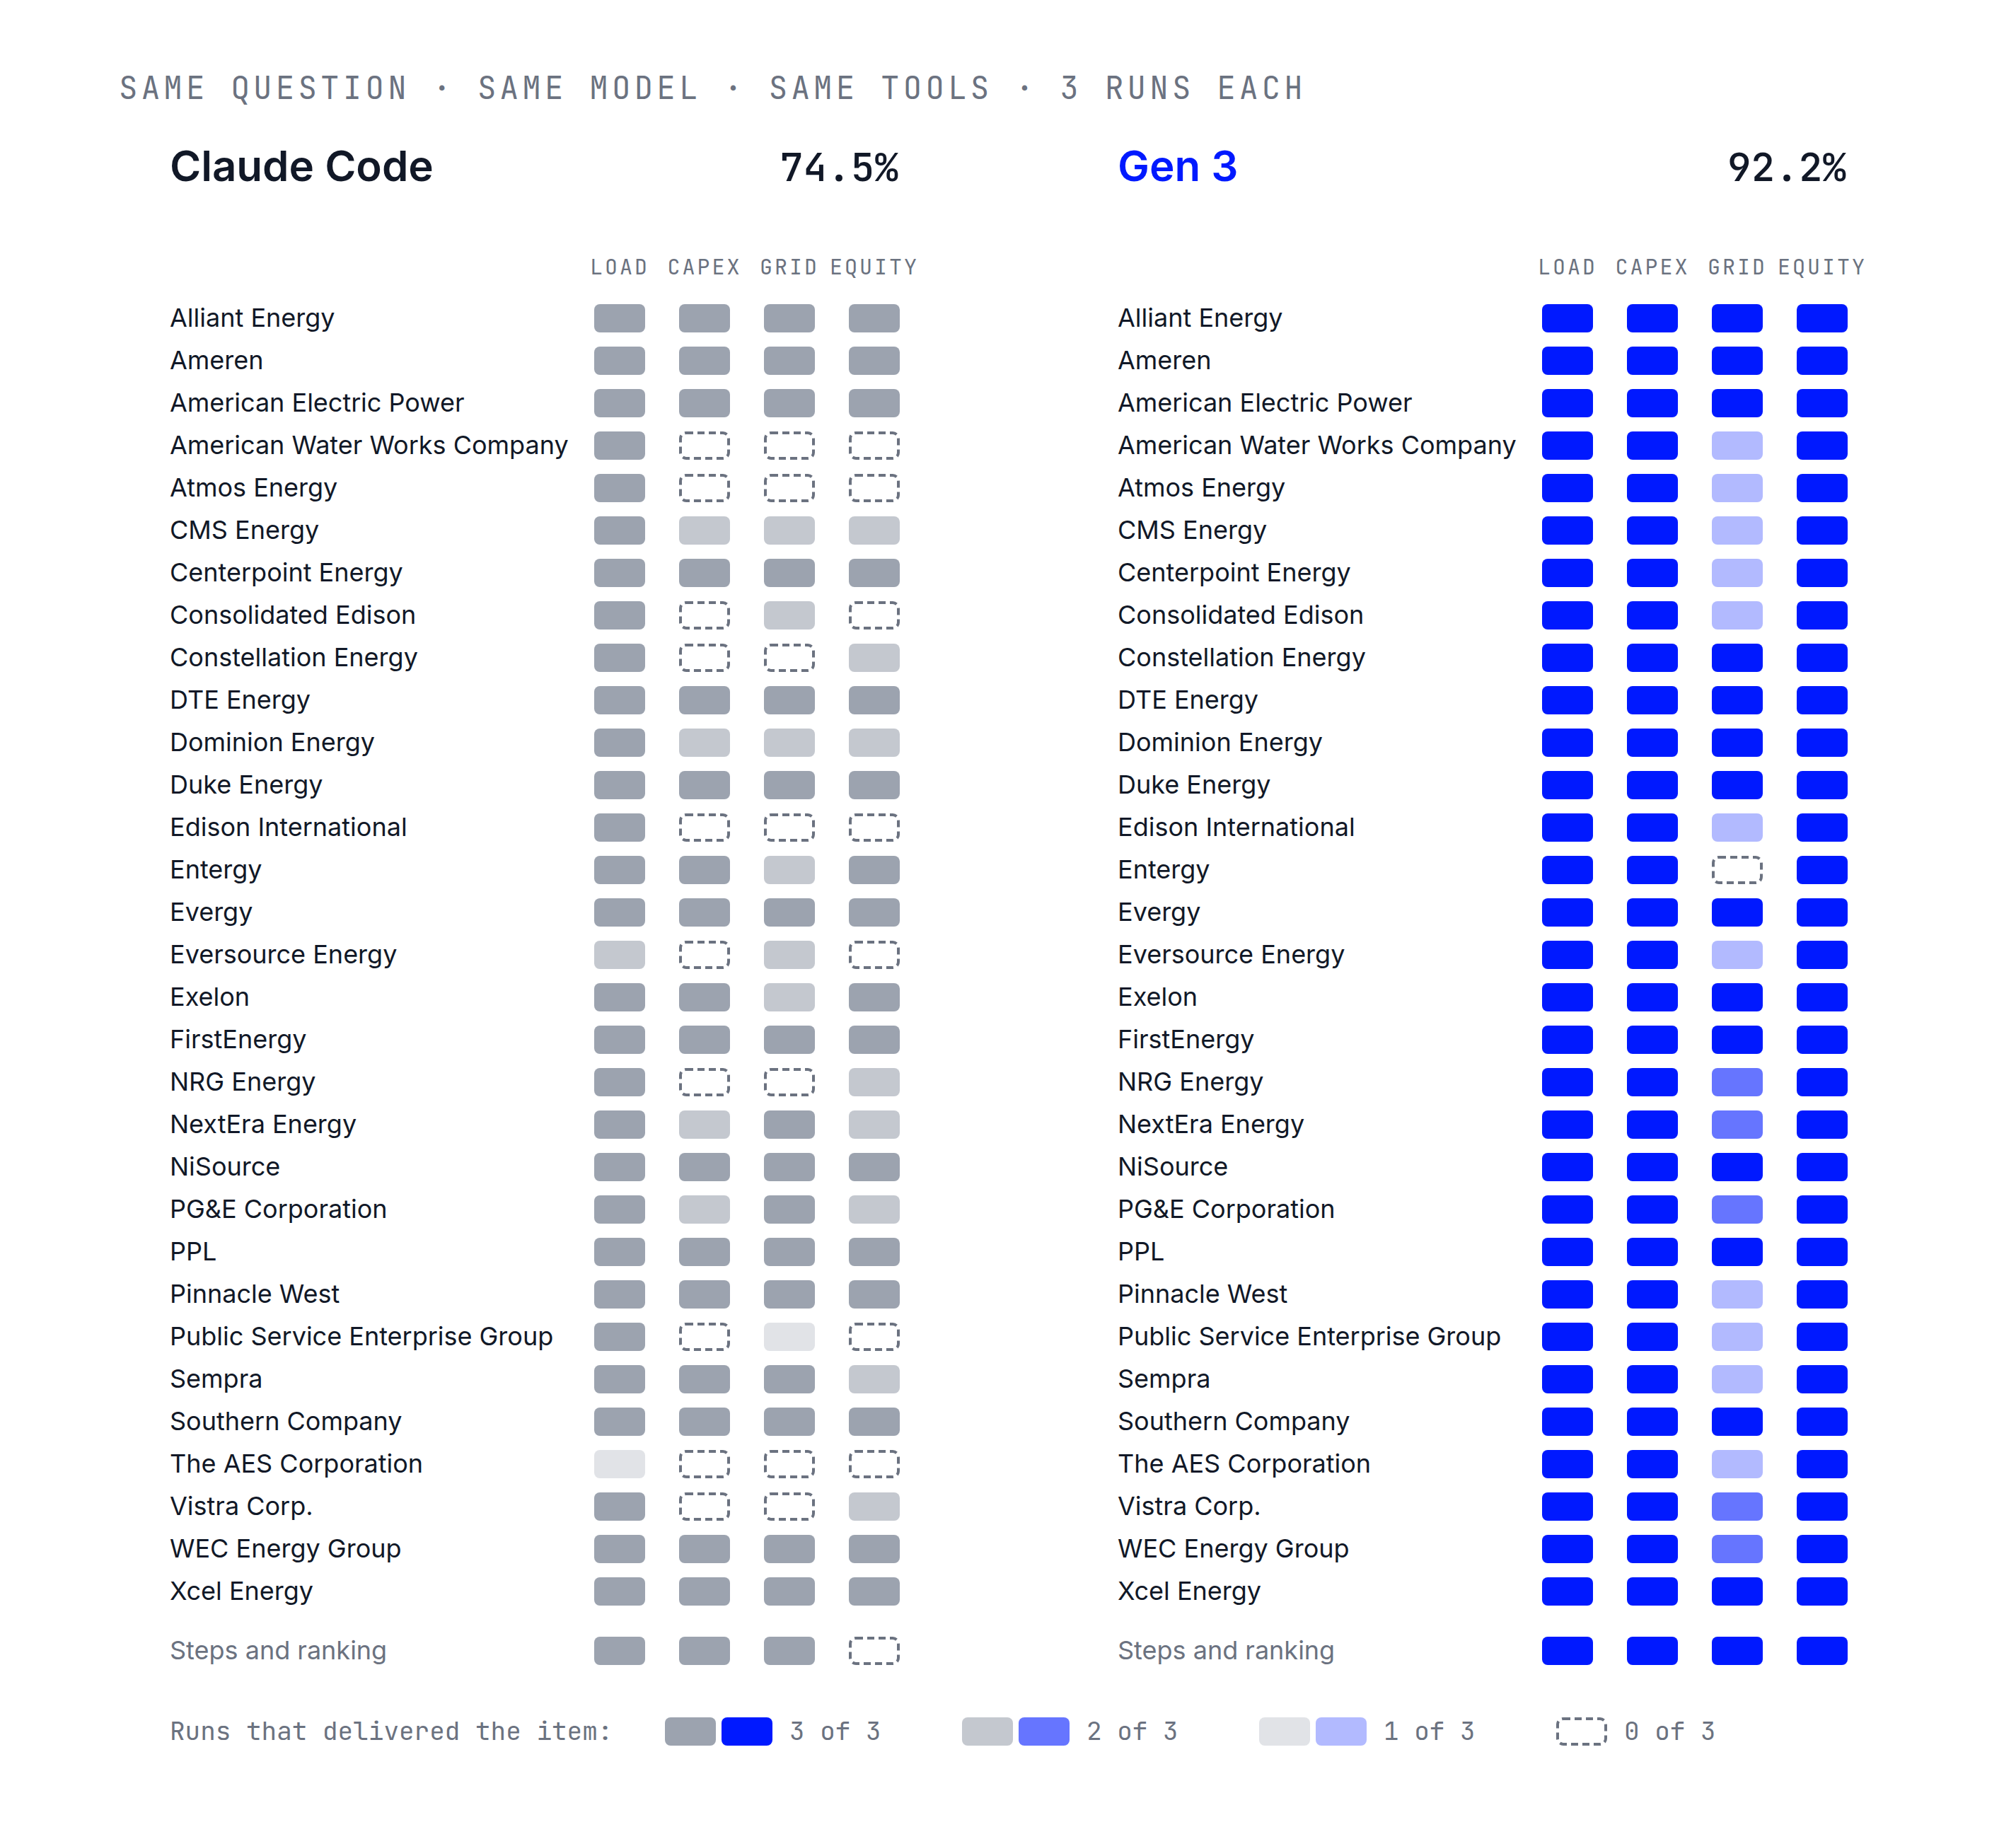
Most of Claude Code’s gaps come from one decision. In each run, it first set aside the utilities it judged not to benefit and then skipped their research. Claude Code made that call on its own, without asking. The question asked for all four items for every utility, and Gen 3’s plan researched every one.
Some of the cuts were also wrong. In the run shown below, Claude Code listed 11 utilities under “Who doesn’t benefit” at the top of its report. Dominion was one of them, even though it has over 12 GW of data-center load under signed contracts. The report dropped it because a pending merger ties its stock to NextEra’s. That is a reason to avoid the stock, not evidence that the utility doesn’t benefit.
Gen 3’s gaps are mostly in the grid column, and they come from its plan. The plan told it to compare each utility’s disclosed contracted load with its grid operator’s forecast. Some utilities, such as Entergy, announce data-center deals without giving a total. Gen 3 followed the plan exactly and reported that the comparison was not possible. In two of its three runs, Claude Code filled the gap itself. Once it used its own estimate, and once it used a broader figure that counted all industries. The judges accepted both. Gen 3 does what the plan says, so the plan’s quality decides the result. That is why a better planner is next on our list.
Here are the two reports in full, one run from each harness. Scroll each column to compare them.
Same model, same tools, same question. The difference is the harness. Gen 3 turned the question into a plan and ran every step for every utility before it wrote the ranking.
What’s next
Running a plan step by step in code is not a new idea. Workflow engines have run long analytical jobs this way for years. Gen 3 pairs that proven approach with language models. The workflow makes sure every step runs. The model does the work inside each step that needs judgment: reading filings, comparing sources and writing the analysis. Real-world financial research needs both.
Gen 3 now runs in production. With it, a question like “Which S&P 500 utilities will actually profit from the AI data-center boom?” no longer gets an answer built on half the index. Every utility in the plan is assigned all four questions. The work that can run in parallel does, and the ranking waits until every answer is in. When the report says which utilities come out ahead, every utility it was asked about has been researched.
That is the standard we want every long research request to meet. Next, we are making it easier to reach: a planner that writes tighter plans and outlines, simpler ways to adjust them before they run, and a way for other AI assistants to hand long research to our deep agents through our MCP server.
Acknowledgements
Gen 3 was a team effort. Thanks to Ashwin Paranjape, Ozan Koyluoglu, Thejas Venkatesh, Jennifer Louie, Matthew Early, Jason Wentworth and Suharsh Sivakumar, who shaped the overall architecture, helped brainstorm the implementation and gave continuous feedback as we evaluated the system.